Concept explainers
Interpretation:
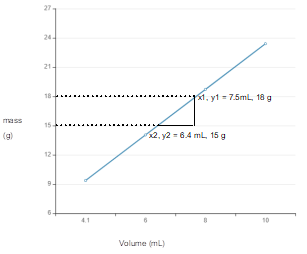
The line graph of given mass and volume data needs to be drawn to interpret the slope of line. Also, the information from that slope of line needs to be deduced.
| Volume | Mass |
| 4.1 mL | 9.36 g |
| 6.0 mL | 14.04 g |
| 8.0 mL | 18.72 g |
| 10.0 mL | 23.40 g |
Concept introduction:
Both mass and volume are physical quantity which are related to each other. The mass of substance per volume is called as density of that substance.
Answer to Problem 138A
Slope = 2.73 g/mL
Slope of line curve gives the density of substance.
Explanation of Solution
Given information:
Mass and volume have linear relation.
Plot the curve with the given data:

Calculate slope:
The slope of line is mass per volume that is density of substance.
Slope of line curve from mass and volume data gives the density of substance.
Chapter 8 Solutions
Chemistry: Matter and Change
Additional Science Textbook Solutions
Microbiology with Diseases by Body System (5th Edition)
Campbell Biology (11th Edition)
Cosmic Perspective Fundamentals
Chemistry: An Introduction to General, Organic, and Biological Chemistry (13th Edition)
Human Anatomy & Physiology (2nd Edition)
Anatomy & Physiology (6th Edition)
- Use the following information to determine the enthalpy for the reaction shown below. → S(s) + O2(g) SO2(9) ΔΗ Π ? Reference reactions: S(s) + O2(g) SO3(9) 2SO2(g) + O2(g) → 2SO3(g) AHxn = -395kJ AHrxn = ― -198kJarrow_forwardQ1. (a) Draw equations for homolytic and heterolytic cleavages of the N-H bond in NH3. Use curved arrows to show the electron movement. (b) Draw equations for homolytic and heterolytic cleavages of the N-H bond in NH4*. Use curved arrows to show the electron movement.arrow_forwardIndicate which of the following is not an element in its standard state at 25oC and 1 atm. Group of answer choices O2(g) H2(g) Ne(g) N(g) C(s, graphite)arrow_forward
- 6. Show how you would accomplish the following transformations. (Show the steps and reagents/solvents needed) 2-methylpropene →2,2-dimethyloxiran Iarrow_forward4) Answer the following exercise with curved arrows indicating who is a nucleophile or Who is the electrophile? 2.44 Predict the structure of the product formed in the reaction of the organic base pyridine with the organic acid acetic acid, and use curved arrows to indicate the direction of electron flow. 7 H3C OH N Pyridine Acetic acidarrow_forwardUsing the data provided please help me answer this question. Determine the concentration of the iron(Ill) salicylate in the unknown directly from to graph and from the best fit trend-line (least squares analysis) of the graph that yielded a straight line.arrow_forward
- Please help me figure out what the slope is and how to calculate the half life Using the data provided.arrow_forwardCurved arrows are used to illustrate the flow of electrons. Follow the curved arrows and draw the structure of the missing reactants, intermediates, or products in the following mechanism. Include all lone pairs. Ignore stereochemistry. Ignore inorganic byproducts. H Br2 (1 equiv) H- Select to Draw Starting Alkene Draw Major Product I I H2O 四: ⑦.. Q Draw Major Charged Intermediate Iarrow_forwardNH (aq)+CNO (aq) → CO(NH2)2(s) Experiment [NH4] (M) [CNO] (M) Initial rate (M/s) 1 0.014 0.02 0.002 23 0.028 0.02 0.008 0.014 0.01 0.001 Calculate the rate contant for this reaction using the data provided in the table.arrow_forward
- 2CIO2 + 20H-1 CIO31 + CIO2 + H2O Experiment [CIO2], M [OH-1], M 1 0.0500 0.100 23 2 0.100 0.100 3 0.100 0.0500 Initial Rate, M/s 0.0575 0.230 0.115 ... Given this date, calculate the overall order of this reaction.arrow_forward2 3 .(be)_[Ɔ+(be)_OI ← (b²)_IƆO+ (be)_I Experiment [1-] M 0.005 [OCI-] 0.005 Initial Rate M/min 0.000275 0.0025 0.005 0.000138 0.0025 0.0025 0.000069 4 0.0025 0.0025 0.000140 Calculate the rate constant of this reaction using the table data.arrow_forward1 2 3 4 I(aq) +OCl(aq) → IO¯¯(aq) + Cl¯(aq) Experiment [I-] M 0.005 [OCI-] 0.005 Initial Rate M/min 0.000275 0.0025 0.005 0.000138 0.0025 0.0025 Calculate the overall order of this reaction using the table data. 0.0025 0.000069 0.0025 0.000140arrow_forward
 ChemistryChemistryISBN:9781305957404Author:Steven S. Zumdahl, Susan A. Zumdahl, Donald J. DeCostePublisher:Cengage Learning
 ChemistryChemistryISBN:9781259911156Author:Raymond Chang Dr., Jason Overby ProfessorPublisher:McGraw-Hill Education
 Principles of Instrumental AnalysisChemistryISBN:9781305577213Author:Douglas A. Skoog, F. James Holler, Stanley R. CrouchPublisher:Cengage Learning
 Organic ChemistryChemistryISBN:9780078021558Author:Janice Gorzynski Smith Dr.Publisher:McGraw-Hill Education
 Chemistry: Principles and ReactionsChemistryISBN:9781305079373Author:William L. Masterton, Cecile N. HurleyPublisher:Cengage Learning
 Elementary Principles of Chemical Processes, Bind...ChemistryISBN:9781118431221Author:Richard M. Felder, Ronald W. Rousseau, Lisa G. BullardPublisher:WILEY


