
Concept explainers
Videos
(a)
To graph:
The
(a)
Explanation of Solution
Given Information:
| temperature, x | Chirps pers second, C |
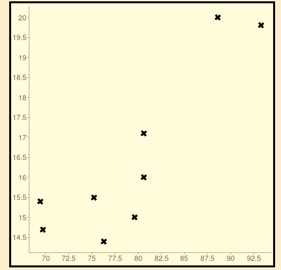
The data list the temperature and the number of chirps per second for the striped ground cricket.
Graph:
Interpretation:
By using the graphing utility, the scatter plot as above.
The above scatter plot shows the data of the list of temperature and the number of chirps per second for the striped ground cricket.
The relation is quadratic function appears to exist between temperature and chirps per second.
(b)
To calculate:
The linear or quadratic model based on (a).
(b)
Answer to Problem 30AYU
The model is
Explanation of Solution
Given information:
| temperature, x | Chirps pers second, C |
The data list the temperature and the number of chirps per second for the striped ground cricket.
Calculation:

Hence, the model is
(c)
To calculate:
The chirps per second if the temperature is
(c)
Answer to Problem 30AYU
The chirps per second if the temperature
Explanation of Solution
Given information:
| temperature, x | Chirps pers second, C |
The data list the temperature and the number of chirps per second for the striped ground cricket.
Calculation:
Chapter 3 Solutions
Precalculus
Additional Math Textbook Solutions
Calculus: Early Transcendentals (2nd Edition)
A Problem Solving Approach To Mathematics For Elementary School Teachers (13th Edition)
Thinking Mathematically (6th Edition)
Elementary Statistics: Picturing the World (7th Edition)
A First Course in Probability (10th Edition)
University Calculus: Early Transcendentals (4th Edition)


- Given y = 4x and y = x² +3, describe the region for Type I and Type II. Type I 8. y + 2 -24 -1 1 2 2.5 X Type II N 1.5- x 1- 0.5 -0.5 -1 1 m y -2> 3 10arrow_forwardGiven D = {(x, y) | O≤x≤2, ½ ≤y≤1 } and f(x, y) = xy then evaluate f(x, y)d using the Type II technique. 1.2 1.0 0.8 y 0.6 0.4 0.2 0- -0.2 0 0.5 1 1.5 2 X X This plot is an example of the function over region D. The region identified in your problem will be slightly different. y upper integration limit Integral Valuearrow_forwardThis way the ratio test was done in this conflicts what I learned which makes it difficult for me to follow. I was taught with the limit as n approaches infinity for (an+1)/(an) = L I need to find the interval of convergence for the series tan-1(x2). (The question has a table of Maclaurin series which I followed as well) https://www.bartleby.com/solution-answer/chapter-92-problem-7e-advanced-placement-calculus-graphical-numerical-algebraic-sixth-edition-high-school-binding-copyright-2020-6th-edition/9781418300203/2c1feea0-c562-4cd3-82af-bef147eadaf9arrow_forward
- Suppose that f(x, y) = y√√r³ +1 on the domain D = {(x, y) | 0 ≤y≤x≤ 1}. D Then the double integral of f(x, y) over D is [ ], f(x, y)dzdy =[ Round your answer to four decimal places.arrow_forwardConsider the function f(x) = 2x² - 8x + 3 over the interval 0 ≤ x ≤ 9. Complete the following steps to find the global (absolute) extrema on the interval. Answer exactly. Separate multiple answers with a comma. a. Find the derivative of f (x) = 2x² - 8x+3 f'(x) b. Find any critical point(s) c within the intervl 0 < x < 9. (Enter as reduced fraction as needed) c. Evaluate the function at the critical point(s). (Enter as reduced fraction as needed. Enter DNE if none of the critical points are inside the interval) f(c) d. Evaluate the function at the endpoints of the interval 0 ≤ x ≤ 9. f(0) f(9) e. Based on the above results, find the global extrema on the interval and where they occur. The global maximum value is at a The global minimum value is at xarrow_forwardDetermine the values and locations of the global (absolute) and local extrema on the graph given. Assume the domain is a closed interval and the graph represents the entirety of the function. 3 y -6-5-4-3 2 1 -1 -2 -3 Separate multiple answers with a comma. Global maximum: y Global minimum: y Local maxima: y Local minima: y x 6 at a at a at x= at x=arrow_forward
- A ball is thrown into the air and its height (in meters) is given by h (t) in seconds. -4.92 + 30t+1, where t is a. After how long does the ball reach its maximum height? Round to 2 decimal places. seconds b. What is the maximum height of the ball? Round to 2 decimal places. metersarrow_forwardDetermine where the absolute and local extrema occur on the graph given. Assume the domain is a closed interval and the graph represents the entirety of the function. 1.5 y 1 0.5 -3 -2 -0.5 -1 -1.5 Separate multiple answers with a comma. Absolute maximum at Absolute minimum at Local maxima at Local minima at a x 2 3 аarrow_forwardA company that produces cell phones has a cost function of C = x² - 1000x + 36100, where C is the cost in dollars and x is the number of cell phones produced (in thousands). How many units of cell phones (in thousands) minimizes this cost function? Round to the nearest whole number, if necessary. thousandarrow_forward
- Under certain conditions, the number of diseased cells N(t) at time t increases at a rate N'(t) = Aekt, where A is the rate of increase at time 0 (in cells per day) and k is a constant. (a) Suppose A = 60, and at 3 days, the cells are growing at a rate of 180 per day. Find a formula for the number of cells after t days, given that 200 cells are present at t = 0. (b) Use your answer from part (a) to find the number of cells present after 8 days. (a) Find a formula for the number of cells, N(t), after t days. N(t) = (Round any numbers in exponents to five decimal places. Round all other numbers to the nearest tenth.)arrow_forwardThe marginal revenue (in thousands of dollars) from the sale of x handheld gaming devices is given by the following function. R'(x) = 4x (x² +26,000) 2 3 (a) Find the total revenue function if the revenue from 125 devices is $17,939. (b) How many devices must be sold for a revenue of at least $50,000? (a) The total revenue function is R(x) = (Round to the nearest integer as needed.) given that the revenue from 125 devices is $17,939.arrow_forwardUse substitution to find the indefinite integral. S 2u √u-4 -du Describe the most appropriate substitution case and the values of u and du. Select the correct choice below and fill in the answer boxes within your choice. A. Substitute u for the quantity in the numerator. Let v = , so that dv = ( ) du. B. Substitute u for the quantity under the root. Let v = u-4, so that dv = (1) du. C. Substitute u for the quantity in the denominator. Let v = Use the substitution to evaluate the integral. so that dv= ' ( du. 2u -du= √√u-4arrow_forward
 Calculus: Early TranscendentalsCalculusISBN:9781285741550Author:James StewartPublisher:Cengage Learning
 Thomas' Calculus (14th Edition)CalculusISBN:9780134438986Author:Joel R. Hass, Christopher E. Heil, Maurice D. WeirPublisher:PEARSON
 Calculus: Early Transcendentals (3rd Edition)CalculusISBN:9780134763644Author:William L. Briggs, Lyle Cochran, Bernard Gillett, Eric SchulzPublisher:PEARSON
 Calculus: Early TranscendentalsCalculusISBN:9781319050740Author:Jon Rogawski, Colin Adams, Robert FranzosaPublisher:W. H. Freeman
 Calculus: Early Transcendental FunctionsCalculusISBN:9781337552516Author:Ron Larson, Bruce H. EdwardsPublisher:Cengage Learning