
Videos
(a)
To draw: a
(a)
Answer to Problem 47RE
Explanation of Solution
Given:
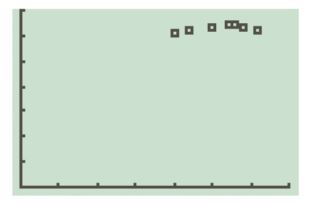
| Advertising | Total revenue |
| 20 | $6101 |
| 22 | $6222 |
| 25 | $6350 |
| 25 | $6378 |
| 27 | $6453 |
| 28 | $6423 |
| 29 | $6360 |
| 31 | $6231 |
Calculation:
Scatter diagram of above data is shown below:

From above graph it appears that the data follows a
Conclusion:
Therefore, a scatter diagram is drawn.
(b)
the optimal level of advertising.
(b)
Answer to Problem 47RE
The optimum level of advertising is
Explanation of Solution
Given:
Calculation:
Compare
The maximum value occurs at
Therefore the optimum level of advertising is
Conclusion:The optimum level of advertising is
(c)
To predict: the total revenue when the optimal level of advertising is spent.
(c)
Answer to Problem 47RE
Total revenue is
Explanation of Solution
Calculation:
The peak income earned is
Therefore total revenue is
Conclusion:
Total revenue is
(d)
To verify: the function given in part (b) is the quadratic function of best fit or not
(d)
Answer to Problem 47RE
The quadratic equation of best fit is
Explanation of Solution
Calculation:
Upon executing the QUADraticREGression program.
The obtained results are shown below:
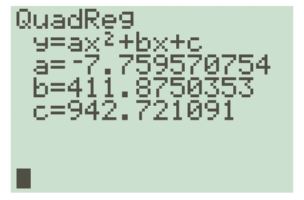
The output that the utility provides shows us the equation
Conclusion:
The quadratic equation of best fit is
(e)
To draw: a graph the quadratic function of best fit
(e)
Answer to Problem 47RE

Explanation of Solution
Calculation:
Graph of the quadratic function found in part d) drawn on the scatter diagram is shown below:
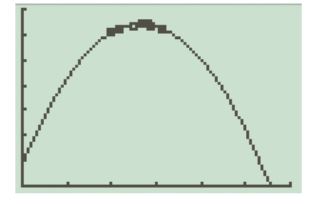
Conclusion:
Thus, the graph the quadratic function is drawn.
Chapter 3 Solutions
Precalculus
Additional Math Textbook Solutions
Elementary Statistics: Picturing the World (7th Edition)
Elementary Statistics
Basic Business Statistics, Student Value Edition
Introductory Statistics
College Algebra with Modeling & Visualization (5th Edition)
University Calculus: Early Transcendentals (4th Edition)


- Let the region R be the area enclosed by the function f(x)= = 3x² and g(x) = 4x. If the region R is the base of a solid such that each cross section perpendicular to the x-axis is an isosceles right triangle with a leg in the region R, find the volume of the solid. You may use a calculator and round to the nearest thousandth. y 11 10 9 00 8 7 9 5 4 3 2 1 -1 -1 x 1 2arrow_forwardLet the region R be the area enclosed by the function f(x) = ex — 1, the horizontal line y = -4 and the vertical lines x = 0 and x = 3. Find the volume of the solid generated when the region R is revolved about the line y = -4. You may use a calculator and round to the nearest thousandth. 20 15 10 5 y I I I | I + -1.5 -1 -0.5 0.5 1 1.5 2 2.5 3 -5 I -10 -15 I + I I T I I + -20 I + -25 I I I -30 I 3.5 4 xarrow_forwardplease show all the workarrow_forward
 Calculus: Early TranscendentalsCalculusISBN:9781285741550Author:James StewartPublisher:Cengage Learning
 Thomas' Calculus (14th Edition)CalculusISBN:9780134438986Author:Joel R. Hass, Christopher E. Heil, Maurice D. WeirPublisher:PEARSON
 Calculus: Early Transcendentals (3rd Edition)CalculusISBN:9780134763644Author:William L. Briggs, Lyle Cochran, Bernard Gillett, Eric SchulzPublisher:PEARSON
 Calculus: Early TranscendentalsCalculusISBN:9781319050740Author:Jon Rogawski, Colin Adams, Robert FranzosaPublisher:W. H. Freeman
 Calculus: Early Transcendental FunctionsCalculusISBN:9781337552516Author:Ron Larson, Bruce H. EdwardsPublisher:Cengage Learning