Concept explainers
Videos
(a)
To draw: a
(a)
Answer to Problem 26AYU
Explanation of Solution
Given:
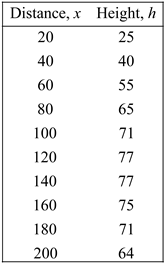
Calculation:
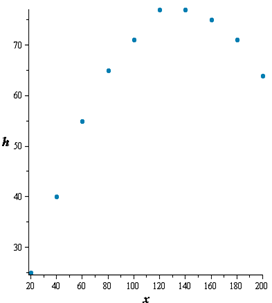
draw scatter diagram of the data and find the type of relation that may existbetween the two variables.

From the above scatter graph of data it is found that there is quadratic relation between the twovariables.
Conclusion:
Thus, the scatter diagram is drawn.
(b)
To find: the quadratic function of best fit
(b)
Answer to Problem 26AYU
The relation between distance and height is
Explanation of Solution
Calculation:
Using the graph utility, the quadratic function of best fit that models the relation between
distance and height is
Conclusion:
The relation between distance and height is
(c)
the distance that the ball will travel before it reaches its maximum height.
(c)
Answer to Problem 26AYU
Hence, the distance is
Explanation of Solution
Calculation:
To determine the distance the ball will travel before it reaches its maximum height, take the
derivative of
Hence, the distance is
Conclusion:
Hence, the distance is
(d)
To find: the maximum height of the ball.
(d)
Answer to Problem 26AYU
Hence, the height is
Explanation of Solution
Calculation:
To find the maximum height, substitute
Hence, the height is
Conclusion:
Hence, the height is
(e)
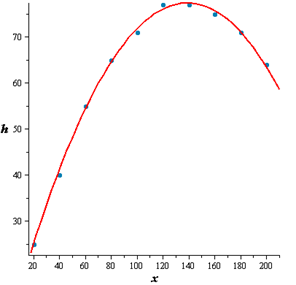
To graph: the quadratic function of best fit on the scatter diagram.
(e)
Answer to Problem 26AYU
Explanation of Solution
Calculation:
Using the graph utility the quadratic function of best fit on the scatter diagram is given below:

Conclusion:
Thus, the required graph is drawn.
Chapter 3 Solutions
Precalculus
Additional Math Textbook Solutions
Elementary Statistics: Picturing the World (7th Edition)
Intro Stats, Books a la Carte Edition (5th Edition)
Calculus: Early Transcendentals (2nd Edition)
Basic Business Statistics, Student Value Edition
Thinking Mathematically (6th Edition)


- u, v and w are three coplanar vectors: ⚫ w has a magnitude of 10 and points along the positive x-axis ⚫ v has a magnitude of 3 and makes an angle of 58 degrees to the positive x- axis ⚫ u has a magnitude of 5 and makes an angle of 119 degrees to the positive x- axis ⚫ vector v is located in between u and w a) Draw a diagram of the three vectors placed tail-to-tail at the origin of an x-y plane. b) If possible, find w × (ū+v) Support your answer mathematically or a with a written explanation. c) If possible, find v. (ū⋅w) Support your answer mathematically or a with a written explanation. d) If possible, find u. (vxw) Support your answer mathematically or a with a written explanation. Note: in this question you can work with the vectors in geometric form or convert them to algebraic vectors.arrow_forwardQuestion 3 (6 points) u, v and w are three coplanar vectors: ⚫ w has a magnitude of 10 and points along the positive x-axis ⚫ v has a magnitude of 3 and makes an angle of 58 degrees to the positive x- axis ⚫ u has a magnitude of 5 and makes an angle of 119 degrees to the positive x- axis ⚫ vector v is located in between u and w a) Draw a diagram of the three vectors placed tail-to-tail at the origin of an x-y plane. b) If possible, find w × (u + v) Support your answer mathematically or a with a written explanation. c) If possible, find v. (ū⋅ w) Support your answer mathematically or a with a written explanation. d) If possible, find u (v × w) Support your answer mathematically or a with a written explanation. Note: in this question you can work with the vectors in geometric form or convert them to algebraic vectors.arrow_forwardK Find all values x = a where the function is discontinuous. For each value of x, give the limit of the function as x approaches a. Be sure to note when the limit doesn't exist. x-7 p(x) = X-7 Select the correct choice below and, if necessary, fill in the answer box(es) within your choice. (Use a comma to separate answers as needed.) OA. f is discontinuous at the single value x = OB. f is discontinuous at the single value x= OC. f is discontinuous at the two values x = OD. f is discontinuous at the two values x = The limit is The limit does not exist and is not co or - ∞. The limit for the smaller value is The limit for the larger value is The limit for the smaller value is The limit for the larger value does not exist and is not c∞ or -arrow_forward
- K x3 +216 complete the table and use the results to find lim k(x). If k(x) = X+6 X-6 X -6.1 -6.01 - 6.001 - 5.999 - 5.99 -5.9 k(x) Complete the table. X -6.1 -6.01 - 6.001 - 5.999 - 5.99 - 5.9 k(x) (Round to three decimal places as needed.) Find the limit. Select the correct choice below and, if necessary, fill in the answer box within your choice.arrow_forwardSketch the slope field that represents the differential equation. × Clear Undo Redo y ४|० || 33 dy dxarrow_forwardSketch the slope field that represents the differential equation. × Clear Undo Redo dy 33 dx = -y "arrow_forward
- Math Test 3 3 x³+y³ = Ꭹ = 9 2 2 x²+y² = 5 x+y=?arrow_forwardFor each of the following series, determine whether the absolute convergence series test determines absolute convergence or fails. For the ¿th series, if the test is inconclusive then let Mi = 4, while if the test determines absolute convergence let Mi 1 : 2: ∞ Σ(−1)"+¹ sin(2n); n=1 Σ n=1 Σ ((−1)”. COS n² 3+2n4 3: (+ 4: 5 : n=1 ∞ n 2+5n3 ПП n² 2 5+2n3 пп n² Σ(+)+ n=1 ∞ n=1 COS 4 2 3+8n3 П ηπ n- (−1)+1 sin (+727) 5 + 2m³ 4 = 8. Then the value of cos(M₁) + cos(2M2) + cos(3M3) + sin(2M) + sin(M5) is -0.027 -0.621 -1.794 -1.132 -1.498 -4.355 -2.000 2.716arrow_forwardi need help with this question i tried by myself and so i am uploadding the question to be quided with step by step solution and please do not use chat gpt i am trying to learn thank you.arrow_forward
- i need help with this question i tried by myself and so i am uploadding the question to be quided with step by step solution and please do not use chat gpt i am trying to learn thank you.arrow_forward1. 3 2 fx=14x²-15x²-9x- 2arrow_forwardNo it is not a graded assignment, its a review question but i only have the final answer not the working or explanationarrow_forward
 Calculus: Early TranscendentalsCalculusISBN:9781285741550Author:James StewartPublisher:Cengage Learning
 Thomas' Calculus (14th Edition)CalculusISBN:9780134438986Author:Joel R. Hass, Christopher E. Heil, Maurice D. WeirPublisher:PEARSON
 Calculus: Early Transcendentals (3rd Edition)CalculusISBN:9780134763644Author:William L. Briggs, Lyle Cochran, Bernard Gillett, Eric SchulzPublisher:PEARSON
 Calculus: Early TranscendentalsCalculusISBN:9781319050740Author:Jon Rogawski, Colin Adams, Robert FranzosaPublisher:W. H. Freeman
 Calculus: Early Transcendental FunctionsCalculusISBN:9781337552516Author:Ron Larson, Bruce H. EdwardsPublisher:Cengage Learning