
Concept explainers
Videos
(a)
To graph:
The
(a)
Explanation of Solution
Given information:
| Age, x | Per. Without a high school diploma, p |
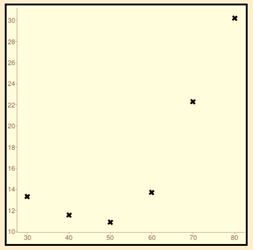
The data represents the percentage of the U.S. population whose age is
Graph:

Interpretation:
By using the graphing utility, the scatter plot is as drawn.
Above scatter plot describes the data of percentage of the U.S. population whose age is
The relation is quadratic function appears to exist between age and percentage of the population without a high school diploma.
(b)
To calculate:
The linear or quadratic model based on (a).
(b)
Answer to Problem 29AYU
A linear or quadratic model that describes the relation between age and percentage of the population that do not have a high school diploma is
Explanation of Solution
Given information:
The data represents the percentage of the U.S. population whose age is
| Age, x | Per. Without a high school diploma, p |
Calculation:
Hence, the function is
(c)
To Calculate:
The percentage of
(c)
Answer to Problem 29AYU
The percentage of
Explanation of Solution
Given information:
The data represents the percentage of the U.S. population whose age is
| Age, x | Per. Without a high school diploma, p |
Calculation:
Hence, the percentage is
Chapter 3 Solutions
Precalculus
Additional Math Textbook Solutions
Introductory Statistics
Calculus: Early Transcendentals (2nd Edition)
Calculus: Early Transcendentals (2nd Edition)
University Calculus: Early Transcendentals (4th Edition)
Elementary Statistics
Calculus for Business, Economics, Life Sciences, and Social Sciences (14th Edition)


- The graph of f' is below. Use it to determine where the local minima and maxima for f are. If there are multiple answers, separate with commas. 2 f'(x) N -5 -4 3-2-1 -1 -2 -3 -4 12 3 4 5 -x Local minima at x Local maxima at xarrow_forwardThe graph of f' is below. Use it to determine the intervals where f is increasing. -5-4-32 4- 3 2 1 -2 -3 +x 2 3 4 5arrow_forwardThe graph of f' is below. Use it to determine where the inflection points are and the intervals where f is concave up and concave down. If there are multiple inflection points, separate with a comma. 6 5 4 3 2 1 f'(x) +x -6-5-4-3 -2 -1 1 2 3 4 5 6 -1 -2 -3 -4 -5 -6+ Inflection point(s) at x = Concave up: Concave down:arrow_forward
- The graph of f' is below. Use it to determine where the local minima and maxima for f are. If there are multiple answers, separate with commas. f'(x) 4- -5-4-3-8-1 3 2 1 x 1 2 3 4 5 -1 -2 -3 -4 Local minima at a Local maxima at =arrow_forwardThe graph of f' is below. Use it to determine the intervals where f is increasing. f'(xx) 4- -5 -3 -2 3 2 1 1 2 3 4 5 Cit +x 7 2arrow_forwardPlease focus on problem ii.arrow_forward
 Calculus: Early TranscendentalsCalculusISBN:9781285741550Author:James StewartPublisher:Cengage Learning
 Thomas' Calculus (14th Edition)CalculusISBN:9780134438986Author:Joel R. Hass, Christopher E. Heil, Maurice D. WeirPublisher:PEARSON
 Calculus: Early Transcendentals (3rd Edition)CalculusISBN:9780134763644Author:William L. Briggs, Lyle Cochran, Bernard Gillett, Eric SchulzPublisher:PEARSON
 Calculus: Early TranscendentalsCalculusISBN:9781319050740Author:Jon Rogawski, Colin Adams, Robert FranzosaPublisher:W. H. Freeman
 Calculus: Early Transcendental FunctionsCalculusISBN:9781337552516Author:Ron Larson, Bruce H. EdwardsPublisher:Cengage Learning