
Concept explainers
Videos
(a)
Interpretation: The rainstorm which dropped the most rain needs to be determined on the basis of given data:
| Strom number | Height | Volume (cm3) |
| 1 | 1 cm | 2.5 |
| 2 | 2.5 cm | 6.3 |
| 3 | 0.5 cm | 1.1 |
| 4 | 8 cm | 20.0 |
| 5 | 5 cm | 12.5 |
Concept Introduction: The dimensional analysis is the method to convert one unit to another with the help of convertor factor.
The conversion factor represents the relation between two units and is used to convert one to another. Both Inch and centimeter are units of length and can be converted into each other whereas cm3 is the unit of volume.
(a)
Answer to Problem 7E
Storm 4 dropped most of rain because the volume is maximum in storm 4. Thus, volume and height are used to determine the storm with most rain.
Explanation of Solution
Given:
| Strom number | Height | Volume (cm3) |
| 1 | 1 cm | 2.5 |
| 2 | 2.5 cm | 6.3 |
| 3 | 0.5 cm | 1.1 |
| 4 | 8 cm | 20.0 |
| 5 | 5 cm | 12.5 |
According to given data the storm number 4 dropped most of rain. This is because volume is highest in storm 4 that is 20.0 cm3.
(b)
Interpretation: The pattern in the rainstorm needs to be determined with below data.
| Strom number | Height | Volume (cm3) |
| 1 | 1 cm | 2.5 |
| 2 | 2.5 cm | 6.3 |
| 3 | 0.5 cm | 1.1 |
| 4 | 8 cm | 20.0 |
| 5 | 5 cm | 12.5 |
Concept Introduction: The dimensional analysis is the method to convert one unit to another with the help of convertor factor.
The conversion factor represents the relation between two units and is used to convert one to another. Both Inch and centimeter are units of length and can be converted into each other whereas cm3 is the unit of volume.
(b)
Answer to Problem 7E
The volume of rain increases from storm 1 to storm 5 therefore it is an increasing pattern.
Explanation of Solution
Given:
| Strom number | Height | Volume (cm3) |
| 1 | 1 cm | 2.5 |
| 2 | 2.5 cm | 6.3 |
| 3 | 0.5 cm | 1.1 |
| 4 | 8 cm | 20.0 |
| 5 | 5 cm | 12.5 |
According to given data the volume of rain and height increase from storm 1 to 5. Therefore it exhibits the increasing pattern.
(c)
Interpretation: The graph between height and volume that show the proportionality of height with volume needs to be drawn.
| Strom number | Height | Volume (cm3) |
| 1 | 1 cm | 2.5 |
| 2 | 2.5 cm | 6.3 |
| 3 | 0.5 cm | 1.1 |
| 4 | 8 cm | 20.0 |
| 5 | 5 cm | 12.5 |
Concept Introduction: The dimensional analysis is the method to convert one unit to another with the help of convertor factor.
The conversion factor represents the relation between two units and is used to convert one to another. Both Inch and centimeter are units of length and can be converted into each other whereas cm3 is the unit of volume.
(c)
Answer to Problem 7E

Explanation of Solution
Given:
| Strom number | Height | Volume (cm3) |
| 1 | 1 cm | 2.5 |
| 2 | 2.5 cm | 6.3 |
| 3 | 0.5 cm | 1.1 |
| 4 | 8 cm | 20.0 |
| 5 | 5 cm | 12.5 |
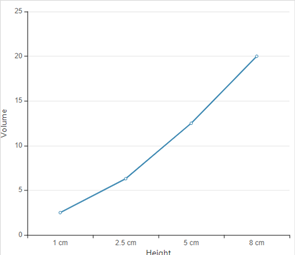
According to given data the graph between height and volume is as given below;

The straight line in curve reflects that with increase in height, the volume of rain increase. Thus height is directly proportional to volume of rain.
(d)
Interpretation: The reason for all the data points to not lie exactly on a straight line needs to be explained.
| Storm number | Height | Volume (cm3) |
| 1 | 0.5 cm | 1.1 |
| 2 | 1 cm | 2.5 |
| 3 | 2.5 cm | 6.3 |
| 4 | 5 cm | 12.5 |
| 5 | 8 cm | 20.0 |
Concept Introduction: The dimensional analysis is the method to convert one unit to another with the help of convertor factor.
The conversion factor represents the relation between two units and is used to convert one to another. Both Inch and centimeter are units of length and can be converted into each other whereas cm3 is the unit of volume.
(d)
Answer to Problem 7E
In the given graph, all the data points do not all lie exactly on a straight line because with the height is not increasing in exact proportion of volume of rain fall.
Explanation of Solution
According to given data the graph between height and volume is as given below;
| Strom number | Height | Volume (cm3) |
| 1 | 0.5 cm | 1.1 |
| 2 | 1 cm | 2.5 |
| 3 | 2.5 cm | 6.3 |
| 4 | 5 cm | 12.5 |
| 5 | 8 cm | 20.0 |
In the given graph, all the data points do not all lie exactly on a straight line because with the height is not increasing in exact proportion of volume of rain fall.
(e)
Interpretation: The volume of rainfall at 6.0 cm height needs to be determined.
| Storm number | Height | Volume (cm3) |
| 1 | 0.5 cm | 1.1 |
| 2 | 1 cm | 2.5 |
| 3 | 2.5 cm | 6.3 |
| 4 | 5 cm | 12.5 |
| 5 | 8 cm | 20.0 |
Concept Introduction: The dimensional analysis is the method to convert one unit to another with the help of convertor factor.
The conversion factor represents the relation between two units and is used to convert one to another. Both Inch and centimeter are units of length and can be converted into each other whereas cm3 is the unit of volume.
(e)
Answer to Problem 7E
At 6.0 height = 15.0 cm3 volume
Explanation of Solution
According to given data the graph between height and volume is as given below;
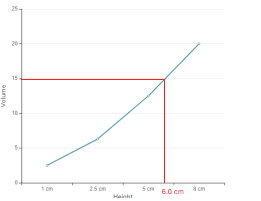
In the platted graph, at height 6.0 cm, the volume of rain fall is 15.0 cm3.
Chapter U3 Solutions
Living By Chemistry: First Edition Textbook
Additional Science Textbook Solutions
Organic Chemistry (8th Edition)
Microbiology: An Introduction
Campbell Biology: Concepts & Connections (9th Edition)
Microbiology: An Introduction
Campbell Essential Biology with Physiology (5th Edition)
Human Anatomy & Physiology (2nd Edition)


- If the molar conductivity at infinite dilution of HAC is A0 = 390.5 S cm² mol¹. Calculate the Arrhenius conductivity of a 9.3% by weight solution of HAc with a pH of 3.3. Data: molecular weight of HAC is 60.05 g/mol and the density of the solution is 1 g/cm³.arrow_forwardIf the molar conductivity at infinite dilution of HAC is A0 = 390.5 S cm² mol¹. Calculate the Arrhenius conductivity of a 9.3% by weight solution of HAc with a pH of 3.3. Data: molecular weight of HAC is 60.05 g/mol and the density of the solution is 1 g/cm³.arrow_forwardDetermine the distance between the metal and the OHP layer using the Helm- holtz model when the electrode's differential capacitance is 145 μF cm². DATA: dielectric constant of the medium for the interfacial zone &r= lectric constant of the vacuum &0 = 8.85-10-12 F m-1 = 50, die-arrow_forward
- Describe a sequence of photophysical processes that can be followed by radiation adsorbed by a molecule in the ground state to give rise to phosphorescent emission.arrow_forwardState two similarities between fluorescence and phosphorescence.arrow_forwardState three photophysical processes that can be related to the effects of incident radiation on a molecule in its ground state. Consider that radiation can give rise to fluorescent emission, but not phosphorescent emission.arrow_forward
 ChemistryChemistryISBN:9781305957404Author:Steven S. Zumdahl, Susan A. Zumdahl, Donald J. DeCostePublisher:Cengage Learning
 ChemistryChemistryISBN:9781259911156Author:Raymond Chang Dr., Jason Overby ProfessorPublisher:McGraw-Hill Education
 Principles of Instrumental AnalysisChemistryISBN:9781305577213Author:Douglas A. Skoog, F. James Holler, Stanley R. CrouchPublisher:Cengage Learning
 Organic ChemistryChemistryISBN:9780078021558Author:Janice Gorzynski Smith Dr.Publisher:McGraw-Hill Education
 Chemistry: Principles and ReactionsChemistryISBN:9781305079373Author:William L. Masterton, Cecile N. HurleyPublisher:Cengage Learning
 Elementary Principles of Chemical Processes, Bind...ChemistryISBN:9781118431221Author:Richard M. Felder, Ronald W. Rousseau, Lisa G. BullardPublisher:WILEY