Concept explainers
(a)
Interpretation : A graph comparing the Celsius scale and Fahrenheit scale is to be created. Also, the freezing point and boiling point of water are to be plotted on the graph.
Concept Introduction :
There are two types of temperature scales, a Celsius scale and a Fahrenheit scale. Celsius scale was created by Andreas Celsius in 1747 and Fahrenheit scale was created by German scientist Daniel Fahrenheit in 1724.
(a)
Answer to Problem 9E
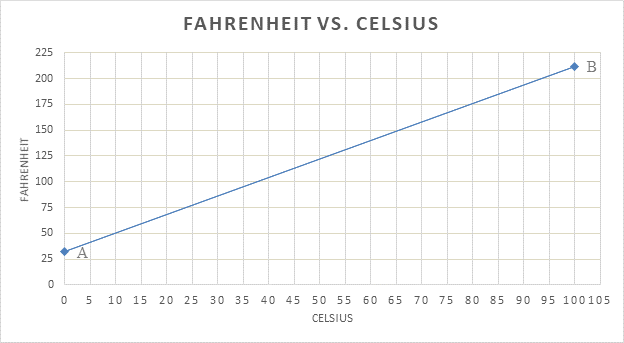
The following graph compares the Celsius scale and Fahrenheit scale:

Point ‘A’ is freezing point of water.
Point ‘B’ is boiling point of water.
Explanation of Solution
A graph can be plotted comparing the Celsius scale and Fahrenheit scale. In Celsius scale the melting temperature of ice is 00C and boiling point of water is 1000C as measured at sea level. On the Fahrenheit scale, the melting temperature of ice is 320F and boiling point of water is 2120F. Hence 00C corresponds to 320F on the graph. This is marked as point ‘A’. 320F corresponds to 1000C and is marked as point ‘B’.
(b)
Interpretation : Using the graph temperature in 0F has to be determined for 100C.
Concept Introduction :
The Celsius scale and Fahrenheit scale graph can be used to convert temperature in degree Celsius to temperature in degree Fahrenheit.
(b)
Answer to Problem 9E

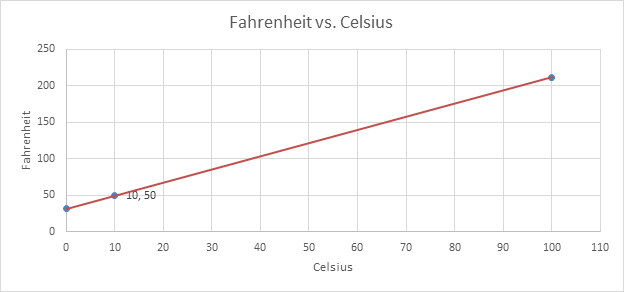
Temperature in 0F for 100C is 500F.
Explanation of Solution
To find out the temperature in 0F for 100C, first draw a vertical line from 10 on Celsius scale (x-axis) up to the red line. From there,draw a horizontal line to reach the corresponding point on Y axis. This is shown by black lines on the graph. The reading on Fahrenheit scale is obtained. In this case it is 500F.
(c)
Interpretation : Using the graph temperature in 0C has to be determined for 550F.
Concept Introduction :
The Celsius scale and Fahrenheit scale graph can be used to convert temperature in degree Fahrenheit totemperature in degree Celsius.
(c)
Answer to Problem 9E

Explanation of Solution
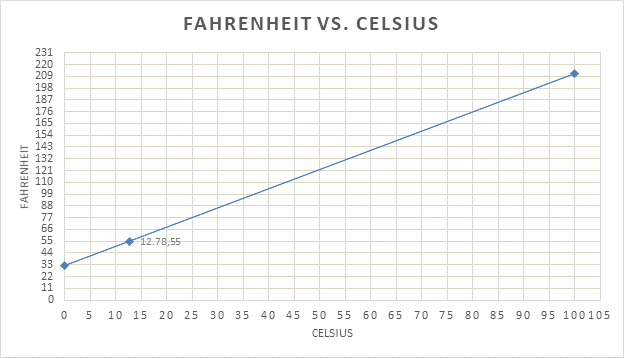
To find out the temperature in 0C for 550F, first draw a horizontal line from 55 on Fahrenheit scale (y-axis) up to the red line. From there, draw a vertical line below to reach the corresponding point on x- axis. This is shown by black lines on the graph. The reading on Celsius scale is obtained. In this case, it is 12.780C.
Chapter U3 Solutions
Living By Chemistry: First Edition Textbook
Additional Science Textbook Solutions
Cosmic Perspective Fundamentals
Biology: Life on Earth (11th Edition)
Campbell Essential Biology (7th Edition)
Human Anatomy & Physiology (2nd Edition)
Anatomy & Physiology (6th Edition)
Campbell Biology: Concepts & Connections (9th Edition)
- Using reaction free energy to predict equilibrium composition Consider the following equilibrium: 2NO2 (g) = N2O4(g) AGº = -5.4 kJ Now suppose a reaction vessel is filled with 4.53 atm of dinitrogen tetroxide (N2O4) at 279. °C. Answer the following questions about this system: Under these conditions, will the pressure of N2O4 tend to rise or fall? Is it possible to reverse this tendency by adding NO2? In other words, if you said the pressure of N2O4 will tend to rise, can that be changed to a tendency to fall by adding NO2? Similarly, if you said the pressure of N2O4 will tend to fall, can that be changed to a tendency to '2' rise by adding NO2? If you said the tendency can be reversed in the second question, calculate the minimum pressure of NO 2 needed to reverse it. Round your answer to 2 significant digits. 00 rise ☐ x10 fall yes no ☐ atm G Ar 1arrow_forwardWhy do we analyse salt?arrow_forwardCurved arrows are used to illustrate the flow of electrons. Using the provided starting and product structures, draw the curved electron-pushing arrows for the following reaction or mechanistic step(s). Be sure to account for all bond-breaking and bond-making steps. H H CH3OH, H+ H Select to Add Arrows H° 0:0 'H + Q HH ■ Select to Add Arrows CH3OH, H* H. H CH3OH, H+ HH ■ Select to Add Arrows i Please select a drawing or reagent from the question areaarrow_forward
- What are examples of analytical methods that can be used to analyse salt in tomato sauce?arrow_forwardA common alkene starting material is shown below. Predict the major product for each reaction. Use a dash or wedge bond to indicate the relative stereochemistry of substituents on asymmetric centers, where applicable. Ignore any inorganic byproducts H Šali OH H OH Select to Edit Select to Draw 1. BH3-THF 1. Hg(OAc)2, H2O =U= 2. H2O2, NaOH 2. NaBH4, NaOH + Please select a drawing or reagent from the question areaarrow_forwardWhat is the MOHR titration & AOAC method? What is it and how does it work? How can it be used to quantify salt in a sample?arrow_forward
- Predict the major products of this reaction. Cl₂ hv ? Draw only the major product or products in the drawing area below. If there's more than one major product, you can draw them in any arrangement you like. Be sure you use wedge and dash bonds if necessary, for example to distinguish between major products with different stereochemistry. If there will be no products because there will be no significant reaction, just check the box under the drawing area and leave it blank. Note for advanced students: you can ignore any products of repeated addition. Explanation Check Click and drag to start drawing a structure. 80 10 m 2025 McGraw Hill LLC. All Rights Reserved. Terms of Use | Privacy Center | Accessibility DII A F1 F2 F3 F4 F5 F6 F7 F8 EO F11arrow_forwardGiven a system with an anodic overpotential, the variation of η as a function of current density- at low fields is linear.- at higher fields, it follows Tafel's law.Calculate the range of current densities for which the overpotential has the same value when calculated for both cases (the maximum relative difference will be 5%, compared to the behavior for higher fields).arrow_forwardUsing reaction free energy to predict equilibrium composition Consider the following equilibrium: N2 (g) + 3H2 (g) = 2NH3 (g) AGº = -34. KJ Now suppose a reaction vessel is filled with 8.06 atm of nitrogen (N2) and 2.58 atm of ammonia (NH3) at 106. °C. Answer the following questions about this system: rise Under these conditions, will the pressure of N2 tend to rise or fall? ☐ x10 fall Is it possible to reverse this tendency by adding H₂? In other words, if you said the pressure of N2 will tend to rise, can that be changed to a tendency to fall by adding H2? Similarly, if you said the pressure of N will tend to fall, can that be changed to a tendency to rise by adding H₂? If you said the tendency can be reversed in the second question, calculate the minimum pressure of H₂ needed to reverse it. Round your answer to 2 significant digits. yes no ☐ atm Х ด ? olo 18 Ararrow_forward
- Four liters of an aqueous solution containing 6.98 mg of acetic acid were prepared. At 25°C, the measured conductivity was 5.89x10⁻³ mS cm-1. Calculate the degree of dissociation of the acid and its ionization constant.Molecular weights: O (15.999), C (12.011), H (1.008).Limiting molar ionic conductivities (λ+0 and λ-0) of Ac-(aq) and H+(aq): 40.9 and 349.8 S cm-2 mol-1.arrow_forwardDetermine the change in Gibbs energy, entropy, and enthalpy at 25°C for the battery from which the data in the table were obtained.T (°C) 15 20 25 30 35Eo (mV) 227.13 224.38 221.87 219.37 216.59Data: n = 1, F = 96485 C mol–1arrow_forwardIndicate the correct options.1. The units of the transport number are Siemens per mole.2. The Siemens and the ohm are not equivalent.3. The Van't Hoff factor is dimensionless.4. Molar conductivity does not depend on the electrolyte concentration.arrow_forward
 ChemistryChemistryISBN:9781305957404Author:Steven S. Zumdahl, Susan A. Zumdahl, Donald J. DeCostePublisher:Cengage Learning
 ChemistryChemistryISBN:9781259911156Author:Raymond Chang Dr., Jason Overby ProfessorPublisher:McGraw-Hill Education
 Principles of Instrumental AnalysisChemistryISBN:9781305577213Author:Douglas A. Skoog, F. James Holler, Stanley R. CrouchPublisher:Cengage Learning
 Organic ChemistryChemistryISBN:9780078021558Author:Janice Gorzynski Smith Dr.Publisher:McGraw-Hill Education
 Chemistry: Principles and ReactionsChemistryISBN:9781305079373Author:William L. Masterton, Cecile N. HurleyPublisher:Cengage Learning
 Elementary Principles of Chemical Processes, Bind...ChemistryISBN:9781118431221Author:Richard M. Felder, Ronald W. Rousseau, Lisa G. BullardPublisher:WILEY


