
Concept explainers
Videos
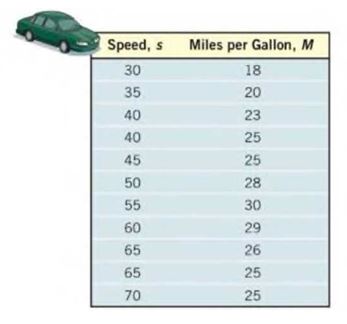
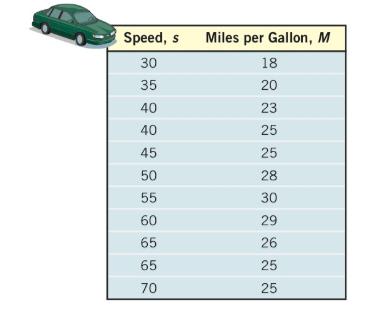
Which Model? An engineer collects the following data showing the speed of a Toyota Camry and its average miles per gallon, .
(a) Using a graphing utility, draw a
(b) Based on your response to part (a), find either a linear model or a quadratic model that describes the relation between speed and miles per gallon.
(c) Use your model to predict the miles per gallon for a Camry that is traveling 63 miles per hour.
To calculate:
a. Graph a scattered diagram and determine the type of relation that exists between the 2 variables.
b. Find the equation of best fit.
c. Predict the miles per gallon for a Camry that is travelling 63 miles per hour.
Answer to Problem 28AYU
a. The graph is given below.
b. The equation of best fit is .
c. The Camry that travels 63 miles per hour will travel per gallons.
Explanation of Solution
Given:
The given data represents the relation between the speed of a Toyota Camry and its average miles per gallon.
Formula used:
For a quadratic equation if is positive, then the vertex is the minimum point and if is negative, the vertex is the maximum point.
Calculation:
We can draw the scatter diagram using Microsoft Excel.
Thus, on entering the and the values on excel, we have to choose the Scatter diagram form the insert option.
Then for getting the equation of best fit, we have to choose the Layout option and then Trendline and then more Trendline option. Then choose the option polynomial and then display the equation.
Thus, we get the scatter diagram with the equation of best fit as
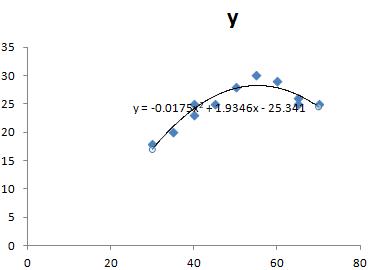
a. The scatter diagram is drawn above and we can see that the given variables exhibit a linear relationship with positive slope.
b. The equation of best fit is .
c. When we get
.
The Camry that travels 63 miles per hour will travel per gallons.
Chapter 3 Solutions
Precalculus Enhanced with Graphing Utilities
Additional Math Textbook Solutions
Algebra and Trigonometry (6th Edition)
University Calculus: Early Transcendentals (4th Edition)
Elementary Statistics
Calculus: Early Transcendentals (2nd Edition)
Elementary Statistics (13th Edition)
Elementary Statistics: Picturing the World (7th Edition)


- 3.12 (B). A horizontal beam AB is 4 m long and of constant flexural rigidity. It is rigidly built-in at the left-hand end A and simply supported on a non-yielding support at the right-hand end B. The beam carries Uniformly distributed vertical loading of 18 kN/m over its whole length, together with a vertical downward load of 10KN at 2.5 m from the end A. Sketch the S.F. and B.M. diagrams for the beam, indicating all main values. Cl. Struct. E.] CS.F. 45,10,376 KN, B.M. 186, +36.15 kNm.7arrow_forwardQize f(x) = x + 2x2 - 2 x² + 4x²² - Solve the equation using Newton Raphsonarrow_forward-b±√√b2-4ac 2a @4x²-12x+9=0 27 de febrero de 2025 -b±√√b2-4ac 2a ⑥2x²-4x-1=0 a = 4 b=-12 c=9 a = 2 b = 9 c = \ x=-42±√(2-4 (4) (9) 2(4)) X = (12) ±√44)-(360) 2(108) x = ±√ X = =±√√²-4(2) (1) 2() X = ±√ + X = X = + X₁ = = X₁ = X₁ = + X₁ = = =arrow_forward
- 3.9 (A/B). A beam ABCDE, with A on the left, is 7 m long and is simply supported at Band E. The lengths of the various portions are AB 1-5m, BC = 1-5m, CD = 1 m and DE : 3 m. There is a uniformly distributed load of 15kN/m between B and a point 2m to the right of B and concentrated loads of 20 KN act at 4 and 0 with one of 50 KN at C. (a) Draw the S.F. diagrams and hence determine the position from A at which the S.F. is zero. (b) Determine the value of the B.M. at this point. (c) Sketch the B.M. diagram approximately to scale, quoting the principal values. [3.32 m, 69.8 KNm, 0, 30, 69.1, 68.1, 0 kNm.]arrow_forward4. Verify that V X (aẢ) = (Va) XẢ + aV X Ả where Ả = xyz(x + y + 2) A and a = 3xy + 4zx by carrying out the detailed differentiations.arrow_forward3. For each of the arrow or quiver graphs shown below, determine analytically V°C and V X Č. From these analytical solutions, identify the extrema (+/-) and plot these points on the arrow graph. (a) C = −✰CosxSiny + ŷSinxCosy -π<ׂу<π Ty (b) C = −xSin2y + ŷCos2y x, y<π -π< (c) C = −xCosx + ŷSiny -π< x, y < πarrow_forward
- 7.10 (B/C). A circular flat plate of diameter 305 mm and thickness 6.35 mm is clamped at the edges and subjected to a Uniform lateral pressure of 345 kN/m². Evaluate: (a) the central deflection, (b) the position and magnitude of the maximum radial stress. C6.1 x 10 m; 149.2 MN/m².] 100 200arrow_forward3.15 (B). A beam ABCD is simply supported at B and C with ABCD=2m; BC 4 m. It carries a point load of 60 KN at the free end A, a Uniformly distributed load of 60 KN/m between B and C and an anticlockwise moment of 80 KN m in the plane of the beam applied at the free end D. Sketch and dimension the S.F. and B.M. diagrams, and determine the position and magnitude of the maximum bending moment. CEL.E.] CS.F. 60, 170, 70KN, B.M. 120, +120.1, +80 kNm, 120.1 kNm at 2.83 m to right of 8.7arrow_forward7.1 (A/B). A Uniform I-section beam has flanges 150 mm wide by 8 mm thick and a web 180 mm wide and 8 mm thick. At a certain section there is a shearing force of 120 KN. Draw a diagram to illustrate the distribution of shear stress across the section as a result of bending. What is the maximum shear stress? [86.7 MN/m².arrow_forward
- 1. Let Ả = −2x + 3y+42, B = - - 7x +lý +22, and C = −1x + 2y + 42. Find (a) Ả X B (b) ẢX B°C c) →→ Ả B X C d) ẢB°C e) ẢX B XC.arrow_forward3.13 (B). A beam ABC, 6 m long, is simply-supported at the left-hand end A and at B I'm from the right-hand end C. The beam is of weight 100 N/metre run. (a) Determine the reactions at A and B. (b) Construct to scales of 20 mm = 1 m and 20 mm = 100 N, the shearing-force diagram for the beam, indicating thereon the principal values. (c) Determine the magnitude and position of the maximum bending moment. (You may, if you so wish, deduce the answers from the shearing force diagram without constructing a full or partial bending-moment diagram.) [C.G.] C240 N, 360 N, 288 Nm, 2.4 m from A.]arrow_forward5. Using parentheses make sense of the expression V · VXVV · Å where Ả = Ã(x, y, z). Is the result a vector or a scaler?arrow_forward
 Calculus: Early TranscendentalsCalculusISBN:9781285741550Author:James StewartPublisher:Cengage Learning
 Thomas' Calculus (14th Edition)CalculusISBN:9780134438986Author:Joel R. Hass, Christopher E. Heil, Maurice D. WeirPublisher:PEARSON
 Calculus: Early Transcendentals (3rd Edition)CalculusISBN:9780134763644Author:William L. Briggs, Lyle Cochran, Bernard Gillett, Eric SchulzPublisher:PEARSON
 Calculus: Early TranscendentalsCalculusISBN:9781319050740Author:Jon Rogawski, Colin Adams, Robert FranzosaPublisher:W. H. Freeman
 Calculus: Early Transcendental FunctionsCalculusISBN:9781337552516Author:Ron Larson, Bruce H. EdwardsPublisher:Cengage Learning