
Concept explainers
Videos
In Problems 11-16,
(a) Draw a
(b) Select two points from the scatter diagram and find the equation of the line containing the points selected.
(c) Graph the line found in part (b) on the scatter diagram.
(d) Use a graphing utility to find the line of best fit.
(e) Use a graphing utility to draw the scatter diagram and graph the line of best fit on it.
To calculate:
- The scatter diagram of the given data.
- Find the equation of a line containing 2 points in the scatter diagram.
- Graph the line found in (b).
- Find the line of best fit using a graphing utility.
- Draw the scatter diagram and the line of best fit using a graphing utility.
Answer to Problem 12AYU
Solution:
a.
b. The equation of the line joining the points and is
c.

d.
e.
Explanation of Solution
Given:
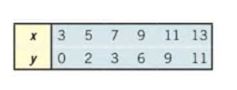
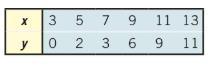
The given data is
Formula used:
The point slope form of the equation of the line with points is
, where .
Calculation:
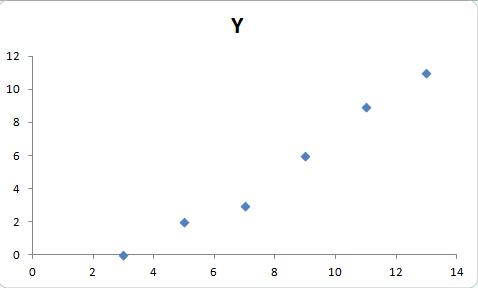
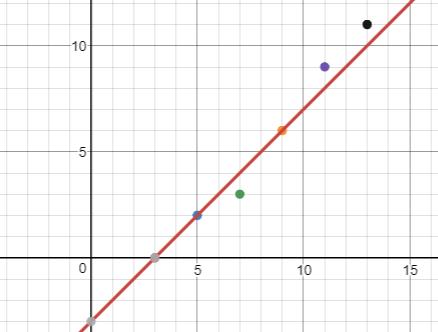
a. The scatter diagram of the given data is

b. Consider the points and .
Here, we have
Therefore, on substituting these in the point slope form of the equation of a line, we get
Therefore,
Thus, the equation of the line joining the points and is
c. The graph of the above line is
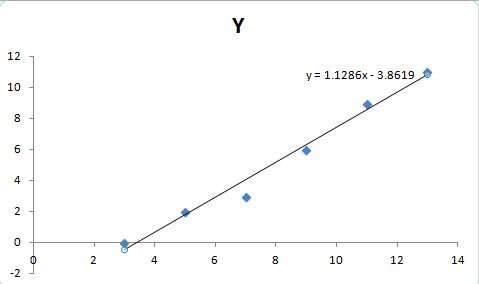
d. Using a graphing utility, we can find the line of best fit to be
e. The line of best fit and the scatter diagram is

Chapter 3 Solutions
Precalculus Enhanced with Graphing Utilities
Additional Math Textbook Solutions
Elementary Statistics (13th Edition)
Intro Stats, Books a la Carte Edition (5th Edition)
Elementary Statistics: Picturing the World (7th Edition)
Elementary Statistics
Algebra and Trigonometry (6th Edition)
A First Course in Probability (10th Edition)


- +6x²+135x+1) (0≤x≤10). a) Find the number of units The total profit P(x) (in thousands of dollars) from a sale of x thousand units of a new product is given by P(x) = In (-x²+6x² + 135x+ that should be sold in order to maximize the total profit. b) What is the maximum profit?arrow_forwardThe fox population in a certain region has an annual growth rate of 8 percent per year. It is estimated that the population in the year 2000 was 22600. (a) Find a function that models the population t years after 2000 (t = 0 for 2000). Your answer is P(t) = (b) Use the function from part (a) to estimate the fox population in the year 2008. Your answer is (the answer should be an integer)arrow_forwardrarrow_forward
- The solutions are 1 where x1 x2- ● Question 11 Solve: x 54 Give your answer as an interval. Question 12arrow_forwardA population of deer in Pierce County currently has 1875 deer, but due to urban development, the population is decreasing at a rate of 1.1% a year. a) Assuming this growth rate continues, find the formula for a function f(t) describing this population. b) In how many years will the population reach 1300? Do the problems on your own paper, show all your work, and submit your scanned work below. Choose File No file chosenarrow_forward● Question 7 Solve the equation. log2(3m - 5) = log2(m +8) m n = Question 8arrow_forward
- Question 6 Find the solution of the exponential equation 2t 100(1.07) 2 = 500,000 in terms of logarithms, or correct to four decimal places. t=arrow_forwardQuestion 6 Find the solution of the exponential equation 100(1.07)² = 500, 000 in terms of logarithms, or correct to four decimal places. t = Question 7 Solve the equation.arrow_forwardI need help on 10arrow_forward
 Calculus: Early TranscendentalsCalculusISBN:9781285741550Author:James StewartPublisher:Cengage Learning
 Thomas' Calculus (14th Edition)CalculusISBN:9780134438986Author:Joel R. Hass, Christopher E. Heil, Maurice D. WeirPublisher:PEARSON
 Calculus: Early Transcendentals (3rd Edition)CalculusISBN:9780134763644Author:William L. Briggs, Lyle Cochran, Bernard Gillett, Eric SchulzPublisher:PEARSON
 Calculus: Early TranscendentalsCalculusISBN:9781319050740Author:Jon Rogawski, Colin Adams, Robert FranzosaPublisher:W. H. Freeman
 Calculus: Early Transcendental FunctionsCalculusISBN:9781337552516Author:Ron Larson, Bruce H. EdwardsPublisher:Cengage Learning