
Videos
In Problems 9-14, (a) graph each quadratic function by determining whether its graph opens up or down and by finding its vertex, axis of symmetry, y-intercept, and x-intercepts, if any. (b) Determine the domain and the range of the function. (c) Determine where the function is increasing and where it is decreasing.
11.
To calculate:
a. Here, we have to graph the given quadratic function by determining its properties.
b. Determine the domain and range of the function.
c. Determine where the function is increasing and decreasing.
Answer to Problem 11RE
Solution:
a. The graph opens upwards.
The vertex of the given function is .
The axis of symmetry is at .
The is .
The function has at and .
The graph of the function is
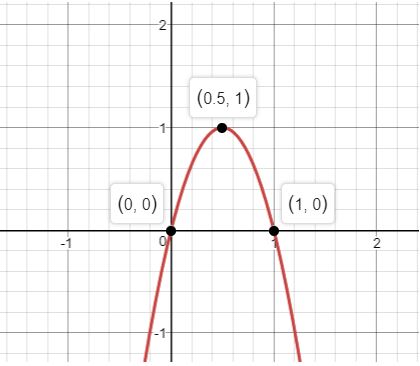
b. The domain of the given function is the set of all real numbers and the range of the given function is .
c. The function is increasing in the interval and decreasing in the interval .
Explanation of Solution
Given:
The given function is
Formula used:
Consider a quadratic function .
If , the graph opens upwards.
If , the graph opens downwards.
The vertex of the above function is .
The axis of symmetry will be .
We can find the by equating the equation at .
We can find the by equation the equation at .
Domain is the set of all possible values that can take.
Range is the possible results for any values of .
Calculation:
The given function is .
d. We can see that and .
Since is negative, the graph opens downwards.
We have and
Therefore, the vertex of the given function is .
The axis of symmetry is at .
The is at .
Thus, the is .
Now, we have to find the .
Thus, we have
and
Therefore, the function has at and .
The graph of the given function is
e. The domain of the given function is the set of all real numbers. The range of the given function is .
f. From the graph, we can see that the function is increasing in the interval and decreasing in the interval .
Chapter 3 Solutions
Precalculus Enhanced with Graphing Utilities
Additional Math Textbook Solutions
A Problem Solving Approach To Mathematics For Elementary School Teachers (13th Edition)
Basic Business Statistics, Student Value Edition
College Algebra with Modeling & Visualization (5th Edition)
University Calculus: Early Transcendentals (4th Edition)
College Algebra (7th Edition)
A First Course in Probability (10th Edition)


- A small company of science writers found that its rate of profit (in thousands of dollars) after t years of operation is given by P'(t) = (5t + 15) (t² + 6t+9) ³. (a) Find the total profit in the first three years. (b) Find the profit in the sixth year of operation. (c) What is happening to the annual profit over the long run? (a) The total profit in the first three years is $ (Round to the nearest dollar as needed.)arrow_forwardFind the area between the curves. x= -2, x = 7, y=2x² +3, y=0 Set up the integral (or integrals) needed to compute this area. Use the smallest possible number of integrals. Select the correct choice below and fill in the answer boxes to complete your choice. A. 7 [[2x² +3] dx -2 B. [[ ] dx+ -2 7 S [ ] dx The area between the curves is (Simplify your answer.)arrow_forwardThe rate at which a substance grows is given by R'(x) = 105e0.3x, where x is the time (in days). What is the total accumulated growth during the first 2.5 days? Set up the definite integral that determines the accumulated growth during the first 2.5 days. 2.5 Growth = (105e0.3x) dx 0 (Type exact answers in terms of e.) Evaluate the definite integral. Growth= (Do not round until the final answer. Then round to one decimal place as needed.)arrow_forward
- Find the total area of the shaded regions. y 18- 16- 14- 12- 10- 8- 6- y=ex+1-e 4- 2- 0- 2 3 4 5 -2 -4- X ☑ The total area of the shaded regions is (Type an integer or decimal rounded to three decimal places as needed.)arrow_forwardThe graph of f(x), shown here, consists of two straight line segments and two quarter circles. Find the 19 value of f(x)dx. 小 Srxdx. 19 f(x)dx y 7 -7 2 12 19 X ☑arrow_forwardCan you solve this two numerical method eqn and teach me.arrow_forward
- Find the area between the following curves. x=-4, x=2, y=ex, and y = 3 - ex Set up the integral (or integrals) needed to compute this area. Use the small (Type exact answers in terms of e.) 3 In 2 A. S √ [3-2e*] dx+ -4 2 S [2ex-3] dx 3 In 2 B. dx Find the area between the curves. Area = (Type an exact answer in terms of e.)arrow_forwardUse the definite integral to find the area between the x-axis and f(x) over the indicated interval. Check first to see if the graph crosses the x-axis in the given interval. f(x)=8-2x²: [0,4] Set up the integral (or integrals) needed to compute this area. Use the smallest possible number of integrals. Select the correct choice below and fill in the answer boxes to ○ A. dx B. 2 S 8-2x² dx+ 4 S 2 8-2x2 dx C. dx + S dx For the interval [0,4], the area between the x-axis and f(x) is (Type an integer or a simplified fraction.)arrow_forwardPollution from a factory is entering a lake. The rate of concentration of the pollutant at time t is 5 given by P'(t) = 126t², where t is the number of years since the factory started introducing pollutants into the lake. Ecologists estimate that the lake can accept a total level of pollution of 600 units before all the fish life in the lake ends. Can the factory operate for 2 years without killing all the fish in the lake? Set up the integral that would determine the pollution level after 2 years. 2 5 126t 2 dt Can the factory operate for 2 years without killing all the fish in the lake? Thee factory can operate for 2 years without killing all the fish in the lake because the value of the integral is , which is less than 600. (Round to the nearest integer as needed.)arrow_forward
- Use the definite integral to find the area between the x-axis and f(x) over the indicated interval. Check first to see if the graph crosses the x-axis in the given interval. f(x)=4x-12; [2,6] The area between the x-axis and f(x) is (Type an integer or a simplified fraction.)arrow_forwardEvaluate the definite integral. 70 √5√2-6 3 dz 70 S 5√2-6 dz= 7 江 (Type an integer or decimal rounded to two decimal places as needed.)arrow_forwardFind the area between the following curves. 2 y=x³-x²+x+4; y=5x² -7x+4 The area between the curves is (Simplify your answer.) ...arrow_forward
 Calculus: Early TranscendentalsCalculusISBN:9781285741550Author:James StewartPublisher:Cengage Learning
 Thomas' Calculus (14th Edition)CalculusISBN:9780134438986Author:Joel R. Hass, Christopher E. Heil, Maurice D. WeirPublisher:PEARSON
 Calculus: Early Transcendentals (3rd Edition)CalculusISBN:9780134763644Author:William L. Briggs, Lyle Cochran, Bernard Gillett, Eric SchulzPublisher:PEARSON
 Calculus: Early TranscendentalsCalculusISBN:9781319050740Author:Jon Rogawski, Colin Adams, Robert FranzosaPublisher:W. H. Freeman
 Calculus: Early Transcendental FunctionsCalculusISBN:9781337552516Author:Ron Larson, Bruce H. EdwardsPublisher:Cengage Learning