
Videos
a.
Does the relation defined by the set of order pairs
a.
Answer to Problem 21AYU
It is not a function.
Explanation of Solution
Given information:
The marketing manager at Levi-Strauss wishes to find a function that relates the demand
Does the relation defined by the set of order pairs
Calculation:
Consider the table,
No, the relation defined by the set of order pairs
Because a function cannot have two values at same input, that is for every
Hence it is not a function.
b.
Draw a
b.
Answer to Problem 21AYU
Explanation of Solution
Given information:
The marketing manager at Levi-Strauss wishes to find a function that relates the demand
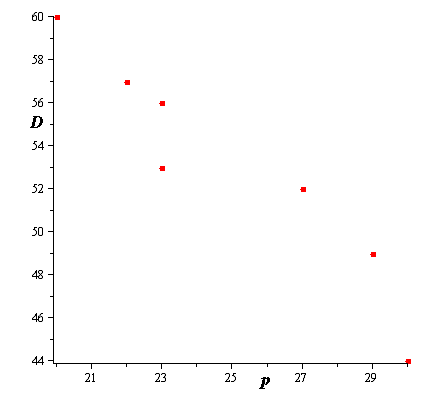
Draw a scatter diagram of the data.
Calculation:
A scatter diagram of the data of the data is,

Hence, the scatter plot is shown in graph.
c.
Use a graphing utility to find the line of best fit that models the relation between price quantity demanded.
c.
Answer to Problem 21AYU
Explanation of Solution
Given information:
The marketing manager at Levi-Strauss wishes to find a function that relates the demand
Use a graphing utility to find the line of best fit that models the relation between price quantity demanded.
Calculation:
Using a graphing utility to find the line of best fit that models the relation between price quantity demanded,
Hence, the line of best fit
d.
Interpret the slope.
d.
Answer to Problem 21AYU
Explanation of Solution
Given information:
The marketing manager at Levi-Strauss wishes to find a function that relates the demand
Interpret the slope.
Calculation:
Consider the line,
Hence, slope of line is
e.
Express the relationship found in part
e.
Answer to Problem 21AYU
Explanation of Solution
Given information:
The marketing manager at Levi-Strauss wishes to find a function that relates the demand
Express the relationship found in part
Calculation:
Hence, the relationship found in part
f.
What is the domain of the function?
f.
Answer to Problem 21AYU
Explanation of Solution
Given information:
The marketing manager at Levi-Strauss wishes to find a function that relates the demand
What is the domain of the function?
Calculation:
As we know that price cannot be negative, so the domain of the function will be from
Put
Hence domain of the function is
g.
How many jeans will be demanded if the price is
g.
Answer to Problem 21AYU
Explanation of Solution
Given information:
The marketing manager at Levi-Strauss wishes to find a function that relates the demand
How many jeans will be demanded if the price is
Calculation:
Jeans will be demanded if the price is
Hence, Jeans will be demanded are
Chapter 3 Solutions
Precalculus Enhanced with Graphing Utilities
Additional Math Textbook Solutions
Algebra and Trigonometry (6th Edition)
Calculus: Early Transcendentals (2nd Edition)
A First Course in Probability (10th Edition)
College Algebra (7th Edition)
Basic Business Statistics, Student Value Edition


- Determine the radius of convergence of a power series:12.6.5, 12.6.6, 12.6.7, 12.6.8Hint: Use Theorem12.5.1 and root test, ratio test, integral testarrow_forwardCan you answer this question and give step by step and why and how to get it. Can you write it (numerical method)arrow_forwardCan you answer this question and give step by step and why and how to get it. Can you write it (numerical method)arrow_forward
- There are three options for investing $1150. The first earns 10% compounded annually, the second earns 10% compounded quarterly, and the third earns 10% compounded continuously. Find equations that model each investment growth and use a graphing utility to graph each model in the same viewing window over a 20-year period. Use the graph to determine which investment yields the highest return after 20 years. What are the differences in earnings among the three investment? STEP 1: The formula for compound interest is A = nt = P(1 + − − ) n², where n is the number of compoundings per year, t is the number of years, r is the interest rate, P is the principal, and A is the amount (balance) after t years. For continuous compounding, the formula reduces to A = Pert Find r and n for each model, and use these values to write A in terms of t for each case. Annual Model r=0.10 A = Y(t) = 1150 (1.10)* n = 1 Quarterly Model r = 0.10 n = 4 A = Q(t) = 1150(1.025) 4t Continuous Model r=0.10 A = C(t) =…arrow_forwardUse a graphing utility to find the point of intersection, if any, of the graphs of the functions. Round your result to three decimal places. (Enter NONE in any unused answer blanks.) y = 100e0.01x (x, y) = y = 11,250 ×arrow_forward5. For the function y-x³-3x²-1, use derivatives to: (a) determine the intervals of increase and decrease. (b) determine the local (relative) maxima and minima. (e) determine the intervals of concavity. (d) determine the points of inflection. (e) sketch the graph with the above information indicated on the graph.arrow_forward
- Can you solve this 2 question numerical methodarrow_forward1. Estimate the area under the graph of f(x)-25-x from x=0 to x=5 using 5 approximating rectangles Using: (A) right endpoints. (B) left endpoints.arrow_forward9. Use fundamental theorem of calculus to find the derivative d a) *dt sin(x) b)(x)√1-2 dtarrow_forward
- 3. Evaluate the definite integral: a) √66x²+8dx b) x dx c) f*(2e* - 2)dx d) √√9-x² e) (2-5x)dx f) cos(x)dx 8)²₁₂√4-x2 h) f7dx i) f² 6xdx j) ²₂(4x+3)dxarrow_forward2. Consider the integral √(2x+1)dx (a) Find the Riemann sum for this integral using right endpoints and n-4. (b) Find the Riemann sum for this same integral, using left endpoints and n=4arrow_forwardProblem 11 (a) A tank is discharging water through an orifice at a depth of T meter below the surface of the water whose area is A m². The following are the values of a for the corresponding values of A: A 1.257 1.390 x 1.50 1.65 1.520 1.650 1.809 1.962 2.123 2.295 2.462|2.650 1.80 1.95 2.10 2.25 2.40 2.55 2.70 2.85 Using the formula -3.0 (0.018)T = dx. calculate T, the time in seconds for the level of the water to drop from 3.0 m to 1.5 m above the orifice. (b) The velocity of a train which starts from rest is given by the fol- lowing table, the time being reckoned in minutes from the start and the speed in km/hour: | † (minutes) |2|4 6 8 10 12 14 16 18 20 v (km/hr) 16 28.8 40 46.4 51.2 32.0 17.6 8 3.2 0 Estimate approximately the total distance ran in 20 minutes.arrow_forward
 Calculus: Early TranscendentalsCalculusISBN:9781285741550Author:James StewartPublisher:Cengage Learning
 Thomas' Calculus (14th Edition)CalculusISBN:9780134438986Author:Joel R. Hass, Christopher E. Heil, Maurice D. WeirPublisher:PEARSON
 Calculus: Early Transcendentals (3rd Edition)CalculusISBN:9780134763644Author:William L. Briggs, Lyle Cochran, Bernard Gillett, Eric SchulzPublisher:PEARSON
 Calculus: Early TranscendentalsCalculusISBN:9781319050740Author:Jon Rogawski, Colin Adams, Robert FranzosaPublisher:W. H. Freeman
 Calculus: Early Transcendental FunctionsCalculusISBN:9781337552516Author:Ron Larson, Bruce H. EdwardsPublisher:Cengage Learning