
Concept explainers
Videos
a
Explain why the number of hours spent playing video games is the independent variable and cumulative grade-point average is the dependent variable.
a
Answer to Problem 19AYU
variable
Explanation of Solution
Given information:
Professor Grant Alexander wanted to find a linear model that relates the number of hours a student plays video games each week,
Explain why the number of hours spent playing video games is the independent variable and cumulative grade-point average is the dependent variable.
Calculation:
The number of hours spent playing video games is the independent variable is totally depends on students own wish, how long he plays a video game or there is no time restriction for students for playing video game as mentioned here.
Number of hours
Further as cumulative grade point average of each student would directly depents on how long student plays video game as the more students plays game, the more game point, he would gain gain resulting a different point average.
Hence, variable
b
Use a graphing utility to draw a
b
Answer to Problem 19AYU
Explanation of Solution
Given information:
Professor Grant Alexander wanted to find a linear model that relates the number of hours a student plays video games each week,
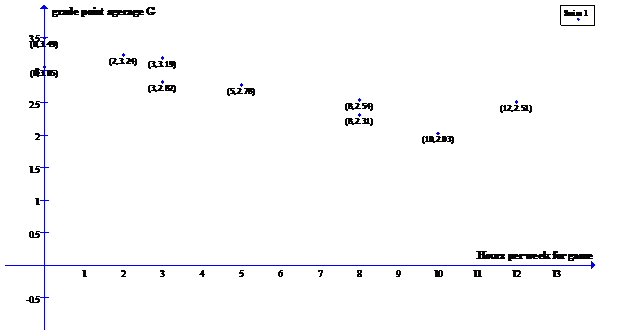
Use a graphing utility to draw a scatter diagram.
Calculation:
Now consider the data given in table,

The number of hours spent playing video games is the independent variable is totally depends on students own wish, how long he plays a video game or there is no time restriction for students for playing video game as mentioned here.
Number of hours
Further as cumulative grade point average of each student would directly depents on how long student plays video game as the more students plays game, the more game point, he would gain gain resulting a different point average.
Hence, variable
c.
Use a graphing utility to draw a scatter diagram.
c.
Answer to Problem 19AYU

Explanation of Solution
Given information:
Professor Grant Alexander wanted to find a linear model that relates the number of hours a student plays video games each week,
Use a graphing utility to find the line of best fit that models the relation between numbers of hours of video game playing each week and grade-point average. Express the model using function notation.
Calculation:
Graphing utilities contain built-in-programs that find the line of best fit for a collection of points in the scatter diagram.
Upon executing the linear regression program, we obtain the results shown as,
The output that utility provides shows us the equation
The line of best fit relates the number of hours plying video games
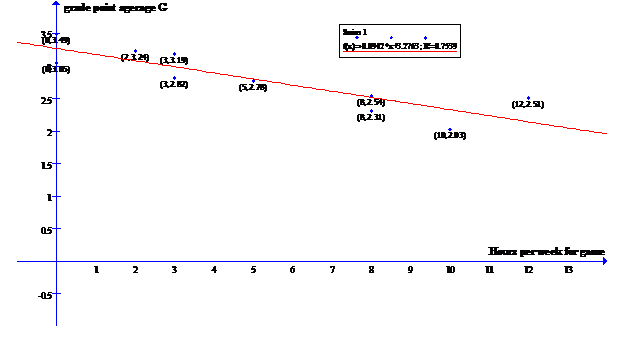
Hence, the graph of line of best fit.
d.
Interpret the slope.
d.
Answer to Problem 19AYU
Explanation of Solution
Given information:
Professor Grant Alexander wanted to find a linear model that relates the number of hours a student plays video games each week,
Interpret the slope.
Calculation:
As we have that any equation in slope-intercept form is written as
Now on comparing it with equation of best line, we observe that
Hence, slope of the line is
d.
Interpret the slope.
d.
Answer to Problem 19AYU
Explanation of Solution
Given information:
Professor Grant Alexander wanted to find a linear model that relates the number of hours a student plays video games each week,
Interpret the slope.
Calculation:
As we have that any equation in slope-intercept form is written as
Now on comparing it with equation of best line, we observe that
Hence, slope of the line is
e.
Find the average of grade points.
e.
Answer to Problem 19AYU
Explanation of Solution
Given information:
Professor Grant Alexander wanted to find a linear model that relates the number of hours a student plays video games each week,
Predict the grade-point average of a student who plays video games for
Calculation:
Consider
Hence, the students who plays game for
f.
Find the time to play game with average points.
f.
Answer to Problem 19AYU
Explanation of Solution
Given information:
Professor Grant Alexander wanted to find a linear model that relates the number of hours a student plays video games each week,
How many hours of video game playing do you think a student plays whose grade- point average is
Calculation:
Consider
Hence, the time to play game with average points
Chapter 3 Solutions
Precalculus Enhanced with Graphing Utilities
Additional Math Textbook Solutions
College Algebra with Modeling & Visualization (5th Edition)
A First Course in Probability (10th Edition)
Elementary Statistics: Picturing the World (7th Edition)
Algebra and Trigonometry (6th Edition)


- Determine the radius of convergence of a power series:12.6.5, 12.6.6, 12.6.7, 12.6.8Hint: Use Theorem12.5.1 and root test, ratio test, integral testarrow_forwardCan you answer this question and give step by step and why and how to get it. Can you write it (numerical method)arrow_forwardCan you answer this question and give step by step and why and how to get it. Can you write it (numerical method)arrow_forward
- There are three options for investing $1150. The first earns 10% compounded annually, the second earns 10% compounded quarterly, and the third earns 10% compounded continuously. Find equations that model each investment growth and use a graphing utility to graph each model in the same viewing window over a 20-year period. Use the graph to determine which investment yields the highest return after 20 years. What are the differences in earnings among the three investment? STEP 1: The formula for compound interest is A = nt = P(1 + − − ) n², where n is the number of compoundings per year, t is the number of years, r is the interest rate, P is the principal, and A is the amount (balance) after t years. For continuous compounding, the formula reduces to A = Pert Find r and n for each model, and use these values to write A in terms of t for each case. Annual Model r=0.10 A = Y(t) = 1150 (1.10)* n = 1 Quarterly Model r = 0.10 n = 4 A = Q(t) = 1150(1.025) 4t Continuous Model r=0.10 A = C(t) =…arrow_forwardUse a graphing utility to find the point of intersection, if any, of the graphs of the functions. Round your result to three decimal places. (Enter NONE in any unused answer blanks.) y = 100e0.01x (x, y) = y = 11,250 ×arrow_forward5. For the function y-x³-3x²-1, use derivatives to: (a) determine the intervals of increase and decrease. (b) determine the local (relative) maxima and minima. (e) determine the intervals of concavity. (d) determine the points of inflection. (e) sketch the graph with the above information indicated on the graph.arrow_forward
- Can you solve this 2 question numerical methodarrow_forward1. Estimate the area under the graph of f(x)-25-x from x=0 to x=5 using 5 approximating rectangles Using: (A) right endpoints. (B) left endpoints.arrow_forward9. Use fundamental theorem of calculus to find the derivative d a) *dt sin(x) b)(x)√1-2 dtarrow_forward
- 3. Evaluate the definite integral: a) √66x²+8dx b) x dx c) f*(2e* - 2)dx d) √√9-x² e) (2-5x)dx f) cos(x)dx 8)²₁₂√4-x2 h) f7dx i) f² 6xdx j) ²₂(4x+3)dxarrow_forward2. Consider the integral √(2x+1)dx (a) Find the Riemann sum for this integral using right endpoints and n-4. (b) Find the Riemann sum for this same integral, using left endpoints and n=4arrow_forwardProblem 11 (a) A tank is discharging water through an orifice at a depth of T meter below the surface of the water whose area is A m². The following are the values of a for the corresponding values of A: A 1.257 1.390 x 1.50 1.65 1.520 1.650 1.809 1.962 2.123 2.295 2.462|2.650 1.80 1.95 2.10 2.25 2.40 2.55 2.70 2.85 Using the formula -3.0 (0.018)T = dx. calculate T, the time in seconds for the level of the water to drop from 3.0 m to 1.5 m above the orifice. (b) The velocity of a train which starts from rest is given by the fol- lowing table, the time being reckoned in minutes from the start and the speed in km/hour: | † (minutes) |2|4 6 8 10 12 14 16 18 20 v (km/hr) 16 28.8 40 46.4 51.2 32.0 17.6 8 3.2 0 Estimate approximately the total distance ran in 20 minutes.arrow_forward
 Calculus: Early TranscendentalsCalculusISBN:9781285741550Author:James StewartPublisher:Cengage Learning
 Thomas' Calculus (14th Edition)CalculusISBN:9780134438986Author:Joel R. Hass, Christopher E. Heil, Maurice D. WeirPublisher:PEARSON
 Calculus: Early Transcendentals (3rd Edition)CalculusISBN:9780134763644Author:William L. Briggs, Lyle Cochran, Bernard Gillett, Eric SchulzPublisher:PEARSON
 Calculus: Early TranscendentalsCalculusISBN:9781319050740Author:Jon Rogawski, Colin Adams, Robert FranzosaPublisher:W. H. Freeman
 Calculus: Early Transcendental FunctionsCalculusISBN:9781337552516Author:Ron Larson, Bruce H. EdwardsPublisher:Cengage Learning