
Videos
a
Draw a
a
Answer to Problem 18AYU

Explanation of Solution
Given information:
The following data represents the weight (in grams) of a box of raisins and the number of raisins in the box.
Draw a scatter diagram of the data treating weight as the independent variable.
Calculation:
Draw a scatter diagram of the data treating weight as the independent variable.
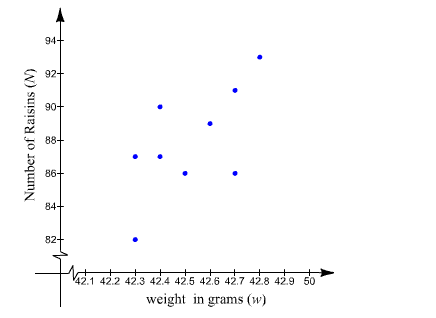
Hence, the result shown in scatter plot.
b.
What type of relation appears to exist between the weight of a candy bar and the number of calories?
b.
Answer to Problem 18AYU
The reletion defind by the set of order pairs
Explanation of Solution
Given information:
The following data represents the weight (in grams) of a box of raisins and the number of raisins in the box.
What type of relation appears to exist between the weight of box of raisins and the number of raisins in the box.
Calculation:
t
A relation is aid to be a function if no first element in the set of ordered pairs is paired with two different second elements
On observing the given table .we can see that for the same weight w, there are diffirent n- valve . that is same of the w-valve have more than one N-valve
Thus the reletion defind by the set of order pairs
Hence, the reletion defind by the set of order pairs
c.
Find a linear model that contains the points.
c.
Answer to Problem 18AYU
Explanation of Solution
Given information:
The following data represents the weight (in grams) of a box of raisins and the number of raisins in the box.
Select two points and find a linear model that contains the points.
Calculation:
Consider points,
Slope
So,
Now find the equation of line that contains the points using point-slope form.
Now substitute
Hence, the equation of line is,
d.
Graph the line on scatter plot.
d.
Answer to Problem 18AYU

Explanation of Solution
Given information:
The following data represents the weight (in grams) of a box of raisins and the number of raisins in the box.
Graph the line on scatter plot drawn in part
Calculation:
In order to graph the line
Similarly other points are,
Let Graph the line on scatter plot.
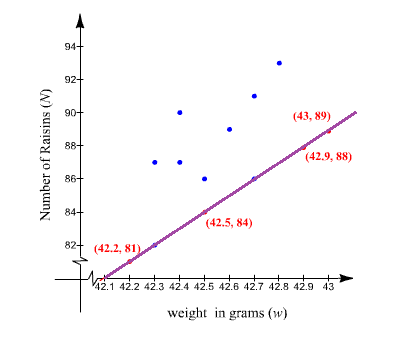
Hence, the graph of line is plotted.
e.
Use the linear model to predict the number of calories in a candy bar.
e.
Answer to Problem 18AYU
Explanation of Solution
Given information:
The following data represents the weight (in grams) of various candy bars and the corresponding number of calories.
Use the linear model to predict the resin in the box weight
Calculation:
Use the linear model to predict the resin in the box weight
Function is
Hence,
f.
Interpret the slope of the line.
f.
Answer to Problem 18AYU
Explanation of Solution
Given information:
The following data represents the weight (in grams) of various candy bars and the corresponding number of calories.
Interpret the slope of the line found in part
Calculation:
Interpret the slope of the line.
If the weight of is increased by
Hence, the number of resins increased by
Chapter 3 Solutions
Precalculus Enhanced with Graphing Utilities
Additional Math Textbook Solutions
College Algebra (7th Edition)
A Problem Solving Approach To Mathematics For Elementary School Teachers (13th Edition)
Elementary Statistics
Calculus: Early Transcendentals (2nd Edition)
University Calculus: Early Transcendentals (4th Edition)


- Can you answer this question and give step by step and why and how to get it. Can you write it (numerical method)arrow_forwardCan you answer this question and give step by step and why and how to get it. Can you write it (numerical method)arrow_forwardThere are three options for investing $1150. The first earns 10% compounded annually, the second earns 10% compounded quarterly, and the third earns 10% compounded continuously. Find equations that model each investment growth and use a graphing utility to graph each model in the same viewing window over a 20-year period. Use the graph to determine which investment yields the highest return after 20 years. What are the differences in earnings among the three investment? STEP 1: The formula for compound interest is A = nt = P(1 + − − ) n², where n is the number of compoundings per year, t is the number of years, r is the interest rate, P is the principal, and A is the amount (balance) after t years. For continuous compounding, the formula reduces to A = Pert Find r and n for each model, and use these values to write A in terms of t for each case. Annual Model r=0.10 A = Y(t) = 1150 (1.10)* n = 1 Quarterly Model r = 0.10 n = 4 A = Q(t) = 1150(1.025) 4t Continuous Model r=0.10 A = C(t) =…arrow_forward
- Use a graphing utility to find the point of intersection, if any, of the graphs of the functions. Round your result to three decimal places. (Enter NONE in any unused answer blanks.) y = 100e0.01x (x, y) = y = 11,250 ×arrow_forward5. For the function y-x³-3x²-1, use derivatives to: (a) determine the intervals of increase and decrease. (b) determine the local (relative) maxima and minima. (e) determine the intervals of concavity. (d) determine the points of inflection. (e) sketch the graph with the above information indicated on the graph.arrow_forwardCan you solve this 2 question numerical methodarrow_forward
- 1. Estimate the area under the graph of f(x)-25-x from x=0 to x=5 using 5 approximating rectangles Using: (A) right endpoints. (B) left endpoints.arrow_forward9. Use fundamental theorem of calculus to find the derivative d a) *dt sin(x) b)(x)√1-2 dtarrow_forward3. Evaluate the definite integral: a) √66x²+8dx b) x dx c) f*(2e* - 2)dx d) √√9-x² e) (2-5x)dx f) cos(x)dx 8)²₁₂√4-x2 h) f7dx i) f² 6xdx j) ²₂(4x+3)dxarrow_forward
- 2. Consider the integral √(2x+1)dx (a) Find the Riemann sum for this integral using right endpoints and n-4. (b) Find the Riemann sum for this same integral, using left endpoints and n=4arrow_forwardProblem 11 (a) A tank is discharging water through an orifice at a depth of T meter below the surface of the water whose area is A m². The following are the values of a for the corresponding values of A: A 1.257 1.390 x 1.50 1.65 1.520 1.650 1.809 1.962 2.123 2.295 2.462|2.650 1.80 1.95 2.10 2.25 2.40 2.55 2.70 2.85 Using the formula -3.0 (0.018)T = dx. calculate T, the time in seconds for the level of the water to drop from 3.0 m to 1.5 m above the orifice. (b) The velocity of a train which starts from rest is given by the fol- lowing table, the time being reckoned in minutes from the start and the speed in km/hour: | † (minutes) |2|4 6 8 10 12 14 16 18 20 v (km/hr) 16 28.8 40 46.4 51.2 32.0 17.6 8 3.2 0 Estimate approximately the total distance ran in 20 minutes.arrow_forwardX Solve numerically: = 0,95 In xarrow_forward
 Calculus: Early TranscendentalsCalculusISBN:9781285741550Author:James StewartPublisher:Cengage Learning
 Thomas' Calculus (14th Edition)CalculusISBN:9780134438986Author:Joel R. Hass, Christopher E. Heil, Maurice D. WeirPublisher:PEARSON
 Calculus: Early Transcendentals (3rd Edition)CalculusISBN:9780134763644Author:William L. Briggs, Lyle Cochran, Bernard Gillett, Eric SchulzPublisher:PEARSON
 Calculus: Early TranscendentalsCalculusISBN:9781319050740Author:Jon Rogawski, Colin Adams, Robert FranzosaPublisher:W. H. Freeman
 Calculus: Early Transcendental FunctionsCalculusISBN:9781337552516Author:Ron Larson, Bruce H. EdwardsPublisher:Cengage Learning