
Concept explainers
Videos
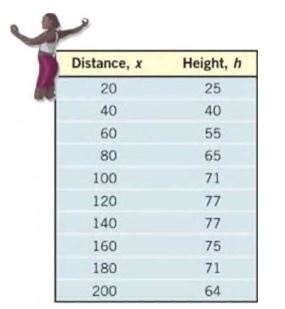
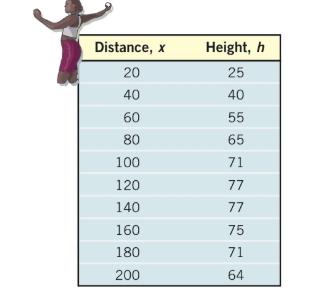
Height of a Rail A shot-putter throws a hall at an inclination of to the horizontal. The following data represent the height of the ball , in feet, at the instant that it has traveled feet horizontally:
(a) Use a graphing utility to draw a
(b) Use a graphing utility to find the quadratic function of best fit that models the relation between distance and height.
(c) Use the function found in part (b) to determine how far the ball will travel before it reaches its maximum height.
(d) Use the function found in part (b) to find the maximum height of the ball.
(e) With a graphing utility, graph the quadratic function of best fit on the scatter diagram.
To calculate:
a. Graph a scattered diagram and determine the type of relation that exists between the 2 variables.
b. Find the quadratic function of best fit.
c. Determine how far the ball will travel before it reaches the maximum height.
d. Find the maximum height of the ball.
e. Graph the quadratic function of best fit.
Answer to Problem 26AYU
a. The graph is given below.
b. The equation of best fit is .
c. The ball will travel feet before it reaches the maximum height.
d. The maximum height attained by the ball is about .
e. The graph is given below.
Explanation of Solution
Given:
A shot putter throws a ball at an inclination of 45 degree to the horizontal. The given data represents the relation between the height of the ball thrown and the distance it travels.
Formula used:
For a quadratic equation if is positive, then the vertex is the minimum point and if is negative, the vertex is the maximum point.
Calculation:
We can draw the scatter diagram using Microsoft Excel.
Thus, on entering the and the values on excel, we have to choose the Scatter diagram form the insert option.
Then for getting the equation of best fit, we have to choose the Layout option and then Trendline and then more Trendline option. Then choose the option polynomial and then display the equation.
Thus, we get the scatter diagram with the equation of best fit as
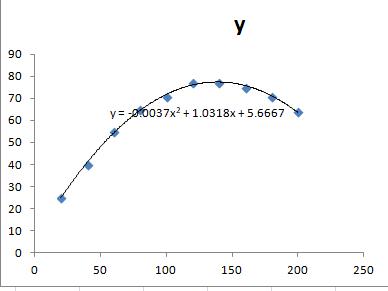
a. The scatter diagram is drawn above and we can see that the given variables exhibit a non-linear polynomial relationship.
b. The equation of best fit is .
c. We can see that the equation of best fit is a quadratic equation with .
Here, is negative, therefore, the vertex is the maximum point.
The value for maximum is
Thus, the ball will travel feet before it reaches the maximum height.
d. The maximum income earned is
The maximum height attained by the ball is about feet.
e. The graph is drawn above.
Chapter 3 Solutions
Precalculus Enhanced with Graphing Utilities
Additional Math Textbook Solutions
A Problem Solving Approach To Mathematics For Elementary School Teachers (13th Edition)
Elementary Statistics
Thinking Mathematically (6th Edition)
Calculus: Early Transcendentals (2nd Edition)
Elementary Statistics (13th Edition)


- Solve please thanks!arrow_forwardSolve please and thank youarrow_forwardAccording to Newton's law of universal gravitation, the force F between two bodies of constant mass GmM m and M is given by the formula F = , where G is the gravitational constant and d is the d² distance between the bodies. a. Suppose that G, m, and M are constants. Find the rate of change of force F with respect to distance d. F' (d) 2GmM b. Find the rate of change of force F with gravitational constant G = 6.67 × 10-¹¹ Nm²/kg², on two bodies 5 meters apart, each with a mass of 250 kilograms. Answer in scientific notation, rounding to 2 decimal places. -6.67x10 N/m syntax incomplete.arrow_forward
- Solve please and thank youarrow_forwardmv2 The centripetal force of an object of mass m is given by F (r) = rotation and r is the distance from the center of rotation. ' where v is the speed of r a. Find the rate of change of centripetal force with respect to the distance from the center of rotation. F(r) b. Find the rate of change of centripetal force of an object with mass 500 kilograms, velocity of 13.86 m/s, and a distance from the center of rotation of 300 meters. Round to 2 decimal places. N/m (or kg/s²) F' (300)arrow_forwardSolve work shown please and thanks!arrow_forward
- Given the following graph of the function y = f(x) and n = = 6, answer the following questions about the area under the curve from x graph to enlarge it.) 1 (Round your answer to within two decimal places if necessary, but do not round until your final computation.) a. Use the Trapezoidal Rule to estimate the area. Estimate: T6 G b. Use Simpson's Rule to estimate the area. Estimate: S6 - ID = 0 to x = 6. (Click on aarrow_forward"Solve the following differential equation using the Operator Method and the Determinant Method:" Solve by dr no ai """'+3y"" + 3y+y=arrow_forward(4,4) M -4 2 2 -4 (-4,-4) 4 8 10 12 (8,-4) (12,-4) Graph of f The figure shows the graph of a piecewise-linear function f. For −4≤x≤12, the function g is x defined by g(x) = √ƒ (t)dt . . Find the value of g(6). Find the value of g'(6). |arrow_forward
- PREVIOUS ANSWERS ASK YOUR TEACHER PRACTICE ANOTHER Find the derivative of the function. f'(x) = X x + √3x f(x) = 3x-5 (3√√3x+11√√x+5√3 2√√x (3x-5)² Need Help? Read It SUBMIT ANSWERarrow_forwardPREVIOUS ANSWERS ASK YOUR TEACHER PRACTICE A Find the derivative of the function and evaluate f'(x) at the given val f(x) = (√√√x + 3x) (x3/2 - x); x = 1 f'(x) = 9x 412 (12x (13) 2 - 4x-3√√√x f'(1) = 2 Need Help? Read It Watch It SUBMIT ANSWERarrow_forwardConsider the following functions. g(x) = x + √3x h(x) = 3x-5 x + √3x f(x) = = 3x-5 Find the derivative of each function. g'(x) h'(x) = = f'(x) = 3 = +1 2√3x 3 (3√3x + 10√√x +5√√√3 2√√x (3x-5)² Need Help? Read It SUBMIT ANSWERarrow_forward
 Calculus: Early TranscendentalsCalculusISBN:9781285741550Author:James StewartPublisher:Cengage Learning
 Thomas' Calculus (14th Edition)CalculusISBN:9780134438986Author:Joel R. Hass, Christopher E. Heil, Maurice D. WeirPublisher:PEARSON
 Calculus: Early Transcendentals (3rd Edition)CalculusISBN:9780134763644Author:William L. Briggs, Lyle Cochran, Bernard Gillett, Eric SchulzPublisher:PEARSON
 Calculus: Early TranscendentalsCalculusISBN:9781319050740Author:Jon Rogawski, Colin Adams, Robert FranzosaPublisher:W. H. Freeman
 Calculus: Early Transcendental FunctionsCalculusISBN:9781337552516Author:Ron Larson, Bruce H. EdwardsPublisher:Cengage Learning