
Concept explainers
Developing a Linear Model from Data How many songs can an iPod hold? The following data represent the memory and the number of songs .
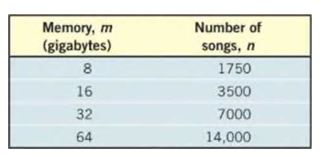
a. Plot the ordered pairs in a Cartesian plane.
b. Show that the number of songs is a linear function of memory .
c. Determine the linear function that describes the relation between and .
d. What is the implied domain of the linear function?
e. Graph the linear function in the Cartesian plane drawn in part (a).
f. Interpret the slope.
To calculate:
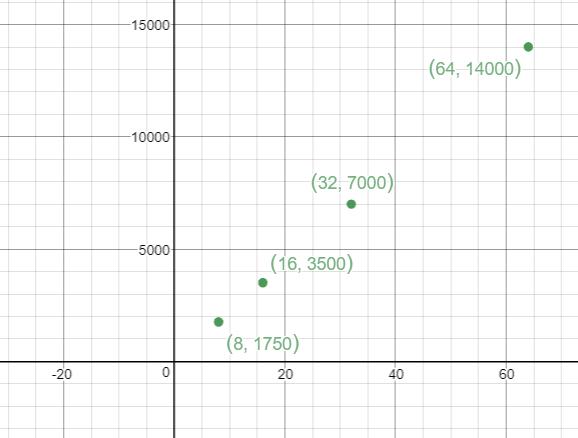
a. Plot the ordered pairs in a Cartesian plane.
b. Show that the number of songs n is a linear function of memory .
c. Determine the linear function that describes the relation between and .
d. What is the implied domain of the linear function?
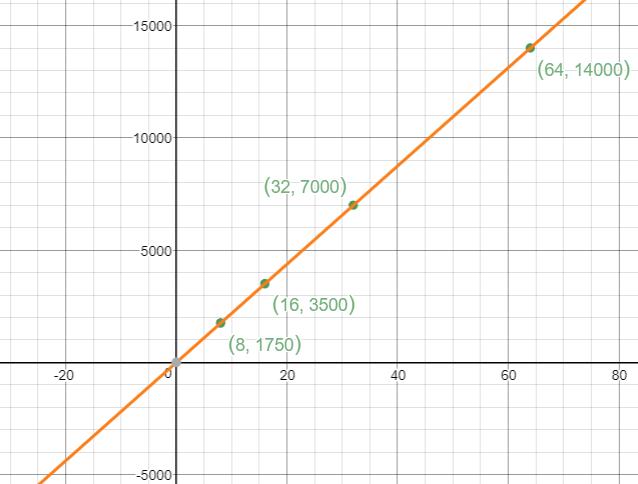
e. Graph the linear function in the Cartesian plane drawn in part (a..
f. Interpret the slope.
Answer to Problem 51AYU
Solution:
a. The plot of the data in Cartesian plane is as shown below:
b. Yes, it is proved that the number of songs n is a liner function of memory .
c. The linear function of the given data is .
d. The implied domain of the given function is .
e. The graph is as shown below:
f. The function is an increasing function.
Explanation of Solution
Given:
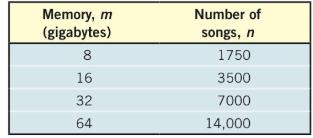
The given data is
Formula Used:
Average rate of change if a function from to is .
Point slope formula:
Calculation:
a. The plot of the given data in a Cartesian plane is
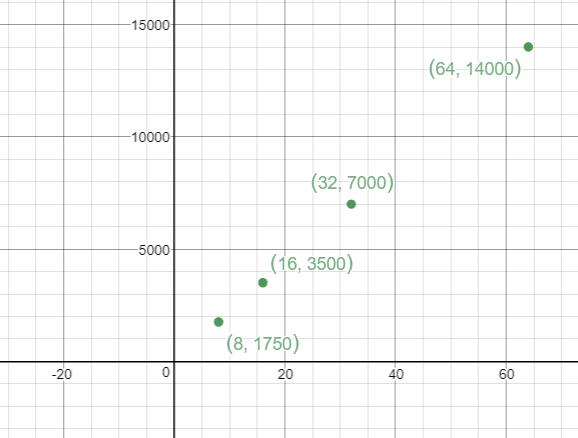
b. Here, in the above Cartesian plane, we can see that the points are arranged in a straight line format.
On joining the given points, we get a straight non vertical line.
Therefore, we can say that the given number of songs is a linear function of memory .
c. From the given data, we can find the average rate of change.
When
Now, we get the average rate of change of the given function as
Thus, the rate of change of the given function is .
Now, we have to use this in the point slope formula, where and .
Thus, we get
Therefore, the linear function of the given data is
d. We can see that the value of in the linear function can be any number. Therefore, the implied domain of the given function is .
e. The graph of the linear function is
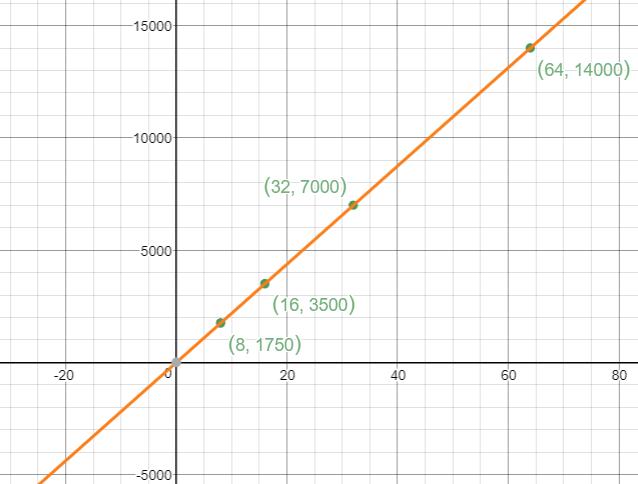
f. We know that the average rate of change of the function is itself its slope.
Thus, here we have seen that the slope is which is a positive number.
Therefore, the function is an increasing function.
Chapter 3 Solutions
Precalculus Enhanced with Graphing Utilities
Additional Math Textbook Solutions
Calculus: Early Transcendentals (2nd Edition)
Basic Business Statistics, Student Value Edition
A Problem Solving Approach To Mathematics For Elementary School Teachers (13th Edition)
Elementary Statistics: Picturing the World (7th Edition)
Thinking Mathematically (6th Edition)
University Calculus: Early Transcendentals (4th Edition)
- The graph of f(x) is given below. Select each true statement about the continuity of f(x) at x = 1. Select all that apply: ☐ f(x) is not continuous at x = 1 because it is not defined at x = 1. ☐ f(x) is not continuous at x = 1 because lim f(x) does not exist. x+1 ☐ f(x) is not continuous at x = 1 because lim f(x) ‡ f(1). x+→1 ☐ f(x) is continuous at x = 1.arrow_forwarda is done please show barrow_forwardA homeware company has been approached to manufacture a cake tin in the shape of a "ghost" from the Pac-Man video game to celebrate the 45th Anniversary of the games launch. The base of the cake tin has a characteristic dimension / and is illustrated in Figure 1 below, you should assume the top and bottom of the shape can be represented by semi-circles. The vertical sides of the cake tin have a height of h. As the company's resident mathematician, you need to find the values of r and h that minimise the internal surface area of the cake tin given that the volume of the tin is Vfixed- 2r Figure 1 - Plan view of the "ghost" cake tin base. (a) Show that the Volume (V) of the cake tin as a function of r and his 2(+1)²h V = 2arrow_forward
- 15. Please solve this and show each and every step please. PLEASE no chatgpt can I have a real person solve it please!! I am stuck. I am doing pratice problems and I do not even know where to start with this. The question is Please compute the indicated functional value.arrow_forwardUse a graph of f to estimate lim f(x) or to show that the limit does not exist. Evaluate f(x) near x = a to support your conjecture. Complete parts (a) and (b). x-a f(x)= 1 - cos (4x-4) 3(x-1)² ; a = 1 a. Use a graphing utility to graph f. Select the correct graph below.. A. W → ✓ Each graph is displayed in a [- 1,3] by [0,5] window. B. in ✓ ○ C. und ☑ Use the graphing utility to estimate lim f(x). Select the correct choice below and, if necessary, fill in the answer box to complete your choice. x-1 ○ A. The limit appears to be approximately ☐ . (Round to the nearest tenth as needed.) B. The limit does not exist. b. Evaluate f(x) for values of x near 1 to support your conjecture. X 0.9 0.99 0.999 1.001 1.01 1.1 f(x) ○ D. + ☑ (Round to six decimal places as needed.) Does the table from the previous step support your conjecture? A. No, it does not. The function f(x) approaches a different value in the table of values than in the graph, after the approached values are rounded to the…arrow_forwardx²-19x+90 Let f(x) = . Complete parts (a) through (c) below. x-a a. For what values of a, if any, does lim f(x) equal a finite number? Select the correct choice below and, if necessary, fill in the answer box to complete your choice. x→a+ ○ A. a= (Type an integer or a simplified fraction. Use a comma to separate answers as needed.) B. There are no values of a for which the limit equals a finite number. b. For what values of a, if any, does lim f(x) = ∞o? Select the correct choice below and, if necessary, fill in the answer boxes to complete your choice. x→a+ A. (Type integers or simplified fractions) C. There are no values of a that satisfy lim f(x) = ∞. + x-a c. For what values of a, if any, does lim f(x) = -∞0? Select the correct choice below and, if necessary, fill in the answer boxes to complete your choice. x→a+ A. Either a (Type integers or simplified fractions) B.arrow_forwardSketch a possible graph of a function f, together with vertical asymptotes, that satisfies all of the following conditions. f(2)=0 f(4) is undefined lim f(x)=1 X-6 lim f(x) = -∞ x-0+ lim f(x) = ∞ lim f(x) = ∞ x-4 _8arrow_forwardDetermine the following limit. lim 35w² +8w+4 w→∞ √49w+w³ 3 Select the correct choice below, and, if necessary, fill in the answer box to complete your choice. ○ A. lim W→∞ 35w² +8w+4 49w+w3 (Simplify your answer.) B. The limit does not exist and is neither ∞ nor - ∞.arrow_forwardCalculate the limit lim X-a x-a 5 using the following factorization formula where n is a positive integer and x-➡a a is a real number. x-a = (x-a) (x1+x-2a+x lim x-a X - a x-a 5 = n- + xa an-2 + an−1)arrow_forwardThe function s(t) represents the position of an object at time t moving along a line. Suppose s(1) = 116 and s(5)=228. Find the average velocity of the object over the interval of time [1,5]. The average velocity over the interval [1,5] is Vav = (Simplify your answer.)arrow_forwardFor the position function s(t) = - 16t² + 105t, complete the following table with the appropriate average velocities. Then make a conjecture about the value of the instantaneous velocity at t = 1. Time Interval Average Velocity [1,2] Complete the following table. Time Interval Average Velocity [1, 1.5] [1, 1.1] [1, 1.01] [1, 1.001] [1,2] [1, 1.5] [1, 1.1] [1, 1.01] [1, 1.001] ப (Type exact answers. Type integers or decimals.) The value of the instantaneous velocity at t = 1 is (Round to the nearest integer as needed.)arrow_forwardFind the following limit or state that it does not exist. Assume b is a fixed real number. (x-b) 40 - 3x + 3b lim x-b x-b ... Select the correct choice below and, if necessary, fill in the answer box to complete your choice. (x-b) 40 -3x+3b A. lim x-b x-b B. The limit does not exist. (Type an exact answer.)arrow_forwardarrow_back_iosSEE MORE QUESTIONSarrow_forward_iosRecommended textbooks for you
 Calculus: Early TranscendentalsCalculusISBN:9781285741550Author:James StewartPublisher:Cengage Learning
 Thomas' Calculus (14th Edition)CalculusISBN:9780134438986Author:Joel R. Hass, Christopher E. Heil, Maurice D. WeirPublisher:PEARSON
 Calculus: Early Transcendentals (3rd Edition)CalculusISBN:9780134763644Author:William L. Briggs, Lyle Cochran, Bernard Gillett, Eric SchulzPublisher:PEARSON
 Calculus: Early TranscendentalsCalculusISBN:9781319050740Author:Jon Rogawski, Colin Adams, Robert FranzosaPublisher:W. H. Freeman
 Calculus: Early Transcendental FunctionsCalculusISBN:9781337552516Author:Ron Larson, Bruce H. EdwardsPublisher:Cengage Learning
 Calculus: Early TranscendentalsCalculusISBN:9781285741550Author:James StewartPublisher:Cengage Learning
 Thomas' Calculus (14th Edition)CalculusISBN:9780134438986Author:Joel R. Hass, Christopher E. Heil, Maurice D. WeirPublisher:PEARSON
 Calculus: Early Transcendentals (3rd Edition)CalculusISBN:9780134763644Author:William L. Briggs, Lyle Cochran, Bernard Gillett, Eric SchulzPublisher:PEARSON
 Calculus: Early TranscendentalsCalculusISBN:9781319050740Author:Jon Rogawski, Colin Adams, Robert FranzosaPublisher:W. H. Freeman
 Calculus: Early Transcendental FunctionsCalculusISBN:9781337552516Author:Ron Larson, Bruce H. EdwardsPublisher:Cengage Learning