
Videos
a
Draw a
a
Answer to Problem 17AYU

Explanation of Solution
Given information:
The following data represents the weight (in grams) of various candy bars and the corresponding number of calories.
Draw a scatter diagram of the data treating weight as the independent variable.
Calculation:
Draw a scatter diagram that relates the weight (in grams) of various candy bars and the corresponding number of calories.
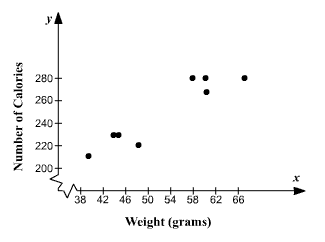
Hence, the result shown in scatter plot.
b.
What type of relation appears to exist between the weight of a candy bar and the number of calories?
b.
Answer to Problem 17AYU
A linear relation exists.
Explanation of Solution
Given information:
The following data represents the weight (in grams) of various candy bars and the corresponding number of calories.
What type of relation appears to exist between the weight of a candy bar and the number of calories?
Calculation:
In the scatter diagram, the plotted points lie somewhat along a straight line that slants downward from left to right.
Hence, a linear relation exists.
c.
Find a linear model that contains the points.
c.
Answer to Problem 17AYU
Explanation of Solution
Given information:
The following data represents the weight (in grams) of various candy bars and the corresponding number of calories.
Select two points and find a linear model that contains the points.
Calculation:
Find a line that fits the data given, select two points from scatter plot and find the slope of line that contains the points.
Consider points,
Slope
So,
Now find the equation of line that contains the points
Now substitute
Hence, the equation of line is,
d.
Graph the line on scatter plot.
d.
Answer to Problem 17AYU

Explanation of Solution
Given information:
The following data represents the weight (in grams) of various candy bars and the corresponding number of calories.
Graph the line on scatter plot drawn in part
Calculation:
Let Graph the line on scatter plot
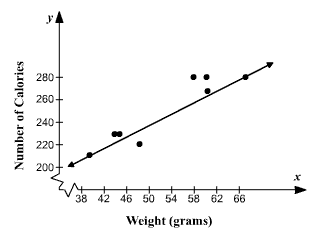
Hence, the graph of line is plotted.
e.
Use the linear model to predict the number of calories in a candy bar.
e.
Answer to Problem 17AYU
Explanation of Solution
Given information:
The following data represents the weight (in grams) of various candy bars and the corresponding number of calories.
Use the linear model to predict the number of calories in a candy bar that weight
Use the linear model to predict the number of calories in a candy bar that weight
Put
Hence, the candy bar that weight
f.
Interpret the slope of the line.
f.
Answer to Problem 17AYU
Explanation of Solution
Given information:
The following data represents the weight (in grams) of various candy bars and the corresponding number of calories.
Use the linear model to predict the number of calories in a candy bar that weight
Interpret the slope of the line found in part
Calculation:
Interpret the slope of the line.
If the weight of candy bar is increased by
Hence, as the candy bar is increased by
Chapter 3 Solutions
Precalculus Enhanced with Graphing Utilities
Additional Math Textbook Solutions
Pre-Algebra Student Edition
Elementary Statistics (13th Edition)
Elementary Statistics
College Algebra (7th Edition)
University Calculus: Early Transcendentals (4th Edition)


- Calculus lll May I please have the solutions for the following examples? Thank youarrow_forwardCalculus lll May I please have the solutions for the following exercises that are blank? Thank youarrow_forwardThe graph of 2(x² + y²)² = 25 (x²-y²), shown in the figure, is a lemniscate of Bernoulli. Find the equation of the tangent line at the point (3,1). -10 Write the expression for the slope in terms of x and y. slope = 4x³ + 4xy2-25x 2 3 4x²y + 4y³ + 25y Write the equation for the line tangent to the point (3,1). LV Q +arrow_forward
- Find the equation of the tangent line at the given value of x on the curve. 2y3+xy-y= 250x4; x=1 y=arrow_forwardFind the equation of the tangent line at the given point on the curve. 3y² -√x=44, (16,4) y=] ...arrow_forwardFor a certain product, cost C and revenue R are given as follows, where x is the number of units sold in hundreds. Cost: C² = x² +92√x+56 Revenue: 898(x-6)² + 24R² = 16,224 dC a. Find the marginal cost at x = 6. dx The marginal cost is estimated to be $ ☐ . (Do not round until the final answer. Then round to the nearest hundredth as needed.)arrow_forward
- The graph of 3 (x² + y²)² = 100 (x² - y²), shown in the figure, is a lemniscate of Bernoulli. Find the equation of the tangent line at the point (4,2). АУ -10 10 Write the expression for the slope in terms of x and y. slope =arrow_forwardUse a geometric series to represent each of the given functions as a power series about x=0, and find their intervals of convergence. a. f(x)=5/(3-x) b. g(x)= 3/(x-2)arrow_forwardAn object of mass 4 kg is given an initial downward velocity of 60 m/sec and then allowed to fall under the influence of gravity. Assume that the force in newtons due to air resistance is - 8v, where v is the velocity of the object in m/sec. Determine the equation of motion of the object. If the object is initially 500 m above the ground, determine when the object will strike the ground. Assume that the acceleration due to gravity is 9.81 m/sec² and let x(t) represent the distance the object has fallen in t seconds. Determine the equation of motion of the object. x(t) = (Use integers or decimals for any numbers in the expression. Round to two decimal places as needed.)arrow_forward
- Early Monday morning, the temperature in the lecture hall has fallen to 40°F, the same as the temperature outside. At 7:00 A.M., the janitor turns on the furnace with the thermostat set at 72°F. The time constant for the building is = 3 hr and that for the building along with its heating system is 1 K A.M.? When will the temperature inside the hall reach 71°F? 1 = 1 hr. Assuming that the outside temperature remains constant, what will be the temperature inside the lecture hall at 8:30 2 At 8:30 A.M., the temperature inside the lecture hall will be about (Round to the nearest tenth as needed.) 1°F.arrow_forwardFind the maximum volume of a rectangular box whose surface area is 1500 cm² and whose total edge length is 200 cm. cm³arrow_forwardFind the minimum cost of a rectangular box of volume 120 cm³ whose top and bottom cost 6 cents per cm² and whose sides cost 5 cents per cm². Round your answer to nearest whole number cents. Cost = cents.arrow_forward
 Calculus: Early TranscendentalsCalculusISBN:9781285741550Author:James StewartPublisher:Cengage Learning
 Thomas' Calculus (14th Edition)CalculusISBN:9780134438986Author:Joel R. Hass, Christopher E. Heil, Maurice D. WeirPublisher:PEARSON
 Calculus: Early Transcendentals (3rd Edition)CalculusISBN:9780134763644Author:William L. Briggs, Lyle Cochran, Bernard Gillett, Eric SchulzPublisher:PEARSON
 Calculus: Early TranscendentalsCalculusISBN:9781319050740Author:Jon Rogawski, Colin Adams, Robert FranzosaPublisher:W. H. Freeman
 Calculus: Early Transcendental FunctionsCalculusISBN:9781337552516Author:Ron Larson, Bruce H. EdwardsPublisher:Cengage Learning