Concept explainers
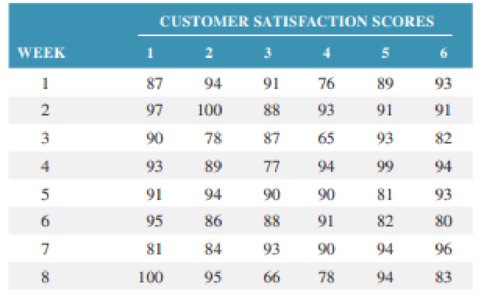
The Shuler Motor Mile is a high-volume discount car dealership that stocks several different makes of cars. It also has a large service department. The dealership telephones six randomly selected customers each week and conducts a survey to determine their satisfaction with the service they received. Each survey results in a customer satisfaction score based on a 100-point scale, where 100 is perfect (and what the dealership ultimately aspires to). Following are the survey results for three months:


- a. Develop an x-chart to be used in conjunction with an R-chart using 3σ limits to monitor the level of customer satisfaction at the dealership and indicate if customer satisfaction is being accomplished on a continuing basis.
- b. The dealership would like to achieve an average customer satisfaction score of 95 (±3); is the service department capable of this?
Want to see the full answer?
Check out a sample textbook solution
Chapter 3 Solutions
Operations and Supply Chain Management, 9th Edition WileyPLUS Registration Card + Loose-leaf Print Companion
Additional Business Textbook Solutions
Operations Management: Processes and Supply Chains (11th Edition)
Principles of Operations Management: Sustainability and Supply Chain Management (10th Edition)
Business in Action (8th Edition)
Operations Management, Binder Ready Version: An Integrated Approach
Operations Management
Business in Action
- Last year's Easter campaign produced these results: 28% of the target audience was exposed 1 time; 21% of the target audience was exposed 2 times; 15% of the target audience was exposed 3 times; 12% of the target audience was exposed 4 times; and no one was exposed more than 4 times. Calculate total GROSS RATING POINTS for the Blue Bunny Easter campaign.arrow_forwardA student group on a college campus wanted to create a survey about parking availability on campus. The student group randomly selected 300 students to take the survey. One of the questions read, “Many students believe the lack of available parking is a major problem. Do you agree or disagree?” Of the 300 students that took the survey, 285 surveys were returned. This survey will most likely suffer from which of the following types of bias? There is no bias in the way this survey is carried out. Response bias Selection bias Non-response biasarrow_forwardThe purpose of the balanced scorecard is best described as helping an organization: translate an organization’s mission and strategy into a set of performance measures that help to implement the strategy introduce innovative products and services desired by target customers mobilize employee skills for continuous improvements in processing capabilities, quality and response times develop customer relationsarrow_forward
- Bo Using data from 50 workers, a researcher estimates Wage = ẞe + B₁Education + B2Experience + B3Age + ε, where Wage is the hourly wage rate and Education, Experience, and Age are the years of higher education, the years of experience, and the age of the worker, respectively. A portion of the regression results is shown in the following table. Intercept Education Experience Age Coefficients Standard Error t Stat p-Value 7.17 4.26 1.68 0.0991 1.81 0.35 5.17 0.0000 0.45 0.10 4.50 0.0000 -0.01 0.06 -0.17 0.8684 a-1. Interpret the point estimate for ẞ1. As Education increases by 1 year, Wage is predicted to increase by 1.81/hour. As Education increases by 1 year, Wage is predicted to increase by 0.45/hour. As Education increases by 1 year, Wage is predicted to increase by 1.81/hour, holding Age and Experience constant. As Education increases by 1 year, Wage is predicted to increase by 0.45/hour, holding Age and Experience constant. a-2. Interpret the point estimate for $2. As Experience…arrow_forwardBlueMoon Bottlers has a bottle-filling process with a mean value of 64 ounces and a standard deviation of 8 ounces. Suppose the upper and lower specification limits are 71 and 57 ounces, respectively. What is the process capability index of this process? (Note: You MUST show every single step and detailed derivation for full credit)arrow_forwardThis is all one question: The following set of questions were developed to administer to the customers of a food catering business. Put yourself in the position of a customer who has ordered food from this catering business at least one time in the past. You have just received this survey in an e‐mail from the catering company. The e‐mail contains a link that takes you to a Web‐based survey process (such as Google Forms or SurveyMonkey). As you read each question, evaluate it carefully. Is it easy to answer? Do understand how to answer? Is there any confusion in your mind about what response is expected? Do you think your answer will be meaningful and useful to the system development team? What is your company's name? On a scale from 1 to 10, how easy do you find the ordering process? 0‐‐‐‐‐‐‐‐‐‐‐‐‐‐‐‐‐‐‐‐‐‐‐‐‐‐‐‐‐‐‐‐‐‐‐‐‐‐‐‐‐‐‐‐‐‐‐‐‐‐‐‐‐‐‐‐‐‐‐‐‐‐‐‐‐‐‐10 How long does it take to place a catering request? In your opinion, what is the biggest problem with the current system of…arrow_forward
- Residents in one housing development were asked a series of Residents in one housing development were asked a series of questions by their homeowners’ association. Identify the type of data for each question. a. Did you play golf during the last month on the development’s new golf course? b. How many times have you eaten at the country club restaurant during the last month? c. Do you own a camper? d. Rate the new security system for the development (very good, good, poor, or very poor). Residents in one housing development were asked a series ofarrow_forwardThe following table gives the number of pints of type A blood used at Damascus Hospital in the past 6 weeks: August 31 September 7 September 14 Week Of September 21 September 28 October 5 Week Of a) The forecasted demand for the week of October 12 using a 3-week moving average = pints (round your response to two decimal places). pints (round your b) Using a 3-week weighted moving average, with weights of 0.10, 0.35, and 0.55, using 0.55 for the most recent week, the forecasted demand for the week of October 12 = response to two decimal places and remember to use the weights in appropriate order the largest weight applies to most recent period and smallest weight applies to oldest period.) c) If the forecasted demand for the week of August 31 is 350 and x = 0.25, using exponential smoothing, develop the forecast for each of the weeks with the known demand and the forecast for the week of October 12 (round your responses to two decimal places). August 31 September 7 September 14…arrow_forwardA team of undergraduate business students was asked to recommend improvement to the data entry process at the county appraiser’s office. The team identified several types of errors, such as posting an incorrect name or entering an incorrect parcel number. The deed abstractors were asked to keep a record of the errors in data entry that were sent to them. The following table is a frequency distribution of errors: Defect Total Posting error in name Posting error in parcel Property sold after tax bills were mailed Inappropriate call transfer (not part of deeds>mapping) Posting error in legal description>incompletelegal description Deeds received after tax bills printed Correspondence errors Miscellaneous errors 23 21 5 18 4 6 2 1 a. Construct a Pareto diagram of these defects in data entry.b. What recommendations would you suggest to the county appraiser?arrow_forward
- An auditor used regression analysis to evaluate the relationship between utility costs andmachine hours. The following information was developed using a computer softwareprogram: Intercept 2,050 Standard error of estimate 200Regression 0.825 Number of observations 36Correlation coefficient 0.800 How much is the utility cost if the company’s 10 machines will use 2,400 hours next month?a. ₱3,830b. ₱3,970c. ₱4,030d. ₱4,050arrow_forwardHouston North Hospital is trying to improve its image by providing a positive experience for its patients and their relatives. Part of the "image" program involves providing tasty, inviting patient meals that are also healthful. A questionnaire accompanies each meal served, asking the patient, among other things, whether he or she is satisfied or unsatisfied with the meal. A 50-patient sample of the survey results over the past 7 days yielded the following data: Day No. of Unsatisfied Patients Sample Size 1 26 50 2 20 50 3 10 50 4 15 50 5 12 50 6 26 50 7 15 50 The control limits to include 99.73% of the random variation in meal satisfaction are: UCLp= (enter your response as a number between 0 and 1, rounded to three decimal places). LCLp = (enter your response as a number between 0 and 1, rounded to three decimal places).…arrow_forwardNike CIO surveyed their employees at the R&D department and collected the following data to help him to decide whether employees should work from home or commute to the work. The data represents the number of miles that employees commute from home to work each day. There are two samples: one for males and one for females. Males: 13 5 2 23 23 14 5 Females: 15 6 3 2 6 Which of the following statements is true? Females have the larger range. The coefficient of variation is larger for males than for females. The coefficient of variation is larger for females than for males. Females have the larger mean.arrow_forward
 Practical Management ScienceOperations ManagementISBN:9781337406659Author:WINSTON, Wayne L.Publisher:Cengage,
 Operations ManagementOperations ManagementISBN:9781259667473Author:William J StevensonPublisher:McGraw-Hill Education
 Operations and Supply Chain Management (Mcgraw-hi...Operations ManagementISBN:9781259666100Author:F. Robert Jacobs, Richard B ChasePublisher:McGraw-Hill Education
 Purchasing and Supply Chain ManagementOperations ManagementISBN:9781285869681Author:Robert M. Monczka, Robert B. Handfield, Larry C. Giunipero, James L. PattersonPublisher:Cengage Learning
 Production and Operations Analysis, Seventh Editi...Operations ManagementISBN:9781478623069Author:Steven Nahmias, Tava Lennon OlsenPublisher:Waveland Press, Inc.


