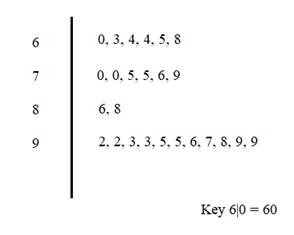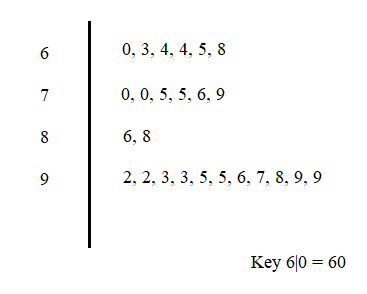
To plot: The stem plot for the data of resting pulse rates of members in the class.
The stem plot of the collected data is shown below

Concept used:
The stem plot is used to display a distribution in the graphical form of stem and leaves to study the shape of the distribution.
Calculation:
The data collected the resting pulse rates (beats per minute) for 25 students as shown below
| 92 | 64 | 96 | 92 | 68 | 70 | 95 | 99 | 75 | 88 |
| 86 | 65 | 76 | 98 | 97 | 79 | 95 | 60 | 63 | 64 |
| 70 | 75 | 99 | 93 | 93 |
The values of resting pulse rates (beats per minute) of 25 students range between 60 to 99, the leaf takes the unit’s place and the digit in ten’s place is written in the stem. For example, the key is

Interpretation:With reference to the stem plot, the data is skewed to the left, and considering the fact that the usual resting heartbeat ranges from 60 beats per minute to 100 beats per minute, there are no outliers in the collected data and it suggests that there are no abnormal heartbeats among the class students.
Chapter 10 Solutions
PRECALCULUS:GRAPHICAL,...-NASTA ED.
- Calculus III May I please have the example, definition semicolons, and all blanks completed and solved? Thank you so much,arrow_forwardA company estimates that the revenue (in dollars) from the sale of x doghouses is given by R(x) = 12,000 In (0.02x+1). Use the differential to approximate the change in revenue from the sale of one more doghouse if 80 doghouses have already been sold. The revenue will increase by $ if one more doghouse is made. (Round to the nearest cent as needed.)arrow_forwardThe population of bacteria (in millions) in a certain culture x hours after an experimental 20x nutrient is introduced into the culture is P(x) = - 2 Use the differential to approximate the changes in population for the following changes in x. 8+x a. 1 to 1.5 b. 3 to 3.25 a. Use the differential to approximate the change in population for x=1 to 1.5. Between 1 and 1.5 hours, the population of bacteria changes by million. (Round to three decimal places as needed.)arrow_forward
- The demand for grass seed (in thousands of pounds) at price p dollars is given by the following function. D(p) 3p³-2p² + 1460 Use the differential to approximate the changes in demand for the following changes in p. a. $4 to $4.11 b. $6 to $6.19arrow_forwardLet the region R be the area enclosed by the function f(x) = 3 ln (x) and g(x) = 3 x + 1. Write an integral in terms of x and also an integral in terms of y that would represent the area of the region R. If necessary, round limit values to the nearest thousandth. Answer Attempt 1 out of 2 y 7 10 6 5 4 3 2 -1 2 3 4 5 6 x2 dx x1 = x2 = x1 Y1 = Y2 = Y1 dyarrow_forwardA manufacturer of handcrafted wine racks has determined that the cost to produce x units per month is given by C = 0.3x² + 7,000. How fast is the cost per month changing when production is changing at the rate of 14 units per month and the production level is 80 units? Costs are increasing at the rate of $ (Round to the nearest dollar as needed.) per month at this production level.arrow_forward
- dy Assume x and y are functions of t. Evaluate for 2xy -3x+2y³ = - 72, with the conditions dt dx dt = -8, x=2, y = -3. dy dt (Type an exact answer in simplified form.)arrow_forwardConsider the sequence below: 1 1 1 (a) Express this sequence as a recurrence relation (b) Express this sequence in the form {a}=1 (c) Does this sequence converge or diverge? Justify your answer. Consider the sequence below: 1 1 1 1, 4' 9' 16' (a) Express this sequence in the form {ak}=1 (b) Does this sequence converge or diverge? Justify your answer. Consider the sequence below: 345 2. 4' 9' 16' ·} (a) Express this sequence in the form {a}1 (b) Does this sequence converge or diverge? Justify your answer.arrow_forwardUse the growth rate of sequences theorem to find the limit or state it divergesarrow_forward
- calculate the maximum value of the directional derivativearrow_forward2. A tank with a capacity of 650 gal. originally contains 200 gal of water with 100 lb. of salt in solution. Water containing 1 lb. of salt per gallon is entering at a rate of 4 gal/min, and the mixture is allowed to flow out of the tank at a rate of 3 gal/min. a. Find the amount of salt in the tank at any time prior to the instant when the tank begins to overflow (650 gallons). b. Find the concentration (in pounds per gallon) of salt in the tank when the tank hits 400 gallons. D.E. for mixture problems: dv dt=11-12 dA A(t) dtarrow_forward- Suppose that you have the differential equation: dy = (y - 2) (y+3) dx a. What are the equilibrium solutions for the differential equation? b. Where is the differential equation increasing or decreasing? Show how you know. Showing them on the drawing is not enough. c. Where are the changes in concavity for the differential equation? Show how you know. Showing them on the drawing is not enough. d. Consider the slope field for the differential equation. Draw solution curves given the following initial conditions: i. y(0) = -5 ii. y(0) = -1 iii. y(0) = 2arrow_forward
 Calculus: Early TranscendentalsCalculusISBN:9781285741550Author:James StewartPublisher:Cengage Learning
 Thomas' Calculus (14th Edition)CalculusISBN:9780134438986Author:Joel R. Hass, Christopher E. Heil, Maurice D. WeirPublisher:PEARSON
 Calculus: Early Transcendentals (3rd Edition)CalculusISBN:9780134763644Author:William L. Briggs, Lyle Cochran, Bernard Gillett, Eric SchulzPublisher:PEARSON
 Calculus: Early TranscendentalsCalculusISBN:9781319050740Author:Jon Rogawski, Colin Adams, Robert FranzosaPublisher:W. H. Freeman
 Calculus: Early Transcendental FunctionsCalculusISBN:9781337552516Author:Ron Larson, Bruce H. EdwardsPublisher:Cengage Learning


