
a)
To plot: A box plot for the set of data where the median is less than the mean of the data distribution.
The set of data where the median is less than the mean and its box plot are shown below
1, 2, 3, 3, 4, 4, 5, 5, 6, 6, 6, 7, 7, 10, 15.

Given:
The collected set of data is 1, 2, 3, 3, 4, 4, 5, 5, 6, 6, 6, 7, 7, 10, 15.
Concept used:
The mean and median are measures of central tendency, the mean is nothing but the average of all values and the median is the middle value of the data distribution in ascending order.
The mean is calculated using the formula
The box plot consists of a box and whisker where it shows five number summary (minimum, first quartile, median, third quartile, maximum). The first quartile divides the data distribution bottom 25% and the top 75% of the data and quartile three divides the bottom 75% and the top 25% of the data.
Calculation:
The mean of the set of data is calculated as shown below
There are a total of 15 data points given in the data distribution arranging them in ascending order, the median of the data distribution is the middle value which is at the 8th position.
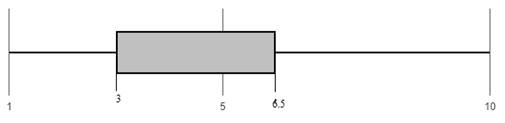
With reference to the given set of data values, the data point at the 8th position is 5. The mean of the data distribution is 5.6 and the median is 5.
Thus for the given data median is less than the mean. The first quartile divides the bottom 25% of the data and the top 75% of the data, it is nothing but the middle value of the values of the first half of the data i.e.
1, 2, 3, 3, 4, 4, 5, 5. There are a total of 8 data values and the middle value is the average of data values at 4th and 5th positions.
The first quartile is 3.5.
The third quartile divides the bottom 75% of the data and the top 25% of the data, it is nothing but the middle value of the values of the second half of the data i.e.
5, 6, 6, 6, 7, 7, 10, 15. There are a total of 8 data values and the middle value is the average of data values at 4th and 5th positions.
The third quartile is 6.5.
The minimum and maximum values of the set of data are 1 and 15 respectively. Thus the five-number summary of the given data set is
Plot:With reference to the five number summary the box plot is sketched as shown below

b)
To plot: A box plot for set of data where twice the interquartile range is less than the range of the data distribution.
The set of data where twice the interquartile range is less than the range and its box plot is shown below
1, 2, 3, 3, 4, 4, 5, 5, 6, 6, 6, 7, 7, 10, 15.
Given:
The collected set of data is 1, 2, 3, 3, 4, 4, 5, 5, 6, 6, 6, 7, 7, 10, 15.
Concept used:
The interquartile range are measures of variability, and it is the range of the middle 50% values of the data distribution. The Interquartile range is the difference between the third Quartile and the first Quartile, where the first quartile divides the data distribution bottom 25% and top 75% of the data and the quartile three divides the data bottom 75% and top 25% of the data.The range is the difference between the maximum and minimum value of the data distribution.
Calculation:
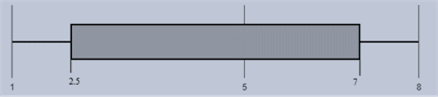
The first quartile is 3.5 and the third quartile is 6.5. The median of the data distribution is 5.
The minimum value of the data distribution is 1 and the maximum value of the data distribution is 15.
The Interquartile range of the set of data is the difference between the third quartile and first quartile and is calculated as shown below
The range of the data distribution is calculated as shown below
The value of twice the Interquartile range is
Thus the given condition twice the interquartile range (6) is less than range (14) is satisfied.
Plot:With reference to the five number summary

c)
To plot: A box plot for the set of data where the range is less than twice the interquartile range of the data distribution.
The set of data where the range is less than twice the interquartile range and its box plot is shown below
1, 2, 2, 2, 3, 4, 5, 5, 6, 6, 7, 7, 7, 7, 8.
Given:
The collected set of data is 1, 2, 2, 2, 3, 4, 5, 5, 6, 6, 7, 7, 7, 7, 8.
Calculation:
There are a total of 15 data points given in the data distribution arranging them in ascending order, the median of the data distribution is the middle value which is at the 8th position.
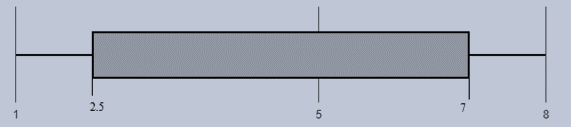
With reference to the given set of data values, the data point at the 8th position is 5. The median is 5. The first quartile divides the bottom 25% of the data and the top 75% of the data, it is nothing but the middle value of the values of the first half of the data i.e.
1, 2, 2, 2, 3, 4, 5, 5. There are a total of 8 data values and the middle value is the average of data values at 4th and 5th positions.
The first quartile is 2.5.
The third quartile divides the bottom 75% of the data and the top 25% of the data, it is nothing but the middle value of the values of the second half of the data i.e.
5, 6, 6, 7, 7, 7, 7, 8. There are a total of 8 data values and the middle value is the average of data values at 4th and 5th positions.
The third quartile is 7.
The minimum and maximum values of the set of data are 1 and 8 respectively. Thus the five-number summary of the given data set is
The Interquartile range of the set of data is the difference between the third quartile and first quartile and is calculated as shown below
The range of the data distribution is calculated as shown below
The value of twice the Interquartile range is
Thus the given condition twice the interquartile range (11) is more than range (7) is satisfied
Plot:With reference to the five number summary
Chapter 10 Solutions
PRECALCULUS:GRAPHICAL,...-NASTA ED.

 Calculus: Early TranscendentalsCalculusISBN:9781285741550Author:James StewartPublisher:Cengage Learning
 Thomas' Calculus (14th Edition)CalculusISBN:9780134438986Author:Joel R. Hass, Christopher E. Heil, Maurice D. WeirPublisher:PEARSON
 Calculus: Early Transcendentals (3rd Edition)CalculusISBN:9780134763644Author:William L. Briggs, Lyle Cochran, Bernard Gillett, Eric SchulzPublisher:PEARSON
 Calculus: Early TranscendentalsCalculusISBN:9781319050740Author:Jon Rogawski, Colin Adams, Robert FranzosaPublisher:W. H. Freeman
 Calculus: Early Transcendental FunctionsCalculusISBN:9781337552516Author:Ron Larson, Bruce H. EdwardsPublisher:Cengage Learning