
(a)
To calculate: The probability of the stock’s value dropping more than 1%.
The probability of the stock’s value dropping more than 1%is approximately is 0.025.
Given:
The expected increase in stock value is 7%.
The standard deviation or volatility of
The distribution of market projections is
Concept used:
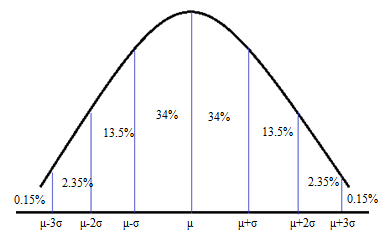
In a normal distribution, the percentage of data within one standard deviation of the mean is about 68%, the percentage of data within two standard deviations of the mean is about 95%, and the percentage of data within three standard deviations of the mean is about 99.7%. The Z score of a data value is the number of standard deviations from the mean and is calculated using the formula
where
Calculation:
The given projection is drop by 1% and its Z score is calculated as shown below
The market projection of a drop by 1% is two standard deviations less than the mean. With reference to the empirical rule, there is 95% of the data within two standard deviations of the mean or there is 47.5% of the data between the mean and two standard deviations above the mean. Mean divides the entire data into two equal parts 50%, thus the percentage of data where the drop in market projection is more than 1% or below two standard deviations from the mean is
Conclusion:
The probability that market projection is dropping more than 1% is
(b)
To calculate: The probability of stocks value increasing between weights 3% and 15%.
The probability of stocks value increasing between weights 3% and 15% is 0.815
Calculation:
With reference to the normal curve and empirical rule, there is about 95% of data within two standard deviations of the mean, and about 68% of the data within one standard deviation of the mean.
The Z scores for given market projections are calculated as shown below
The given market projections 3%, and 15% are one standard deviations less than mean and two standard deviations more than mean respectively.
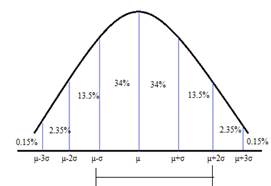
With reference to the empirical rule the percentage of data between the mean and one standard deviation less than the mean is about 34% and the percentage of data between the mean and the two standard deviations above the mean is 47.5%. Thus the percentage of data between one standard deviation less than the mean and two standard deviations more than the mean is
Conclusion:
The probability that market projection is increasing between 3%. and 15% is about
(c)
To calculate: The market projection which is worst 16% of the expected outcome.
The market projection which is worst 16% of the expected outcome is increase by 3%.
Calculation:
With reference to the normal curve and empirical rule, there is about 68% of data is within one standard deviation from the mean and about 16% of data in each tail.
Thus the worst 16% of data will be below the one standard deviations below the mean (-1) and is calculated as shown below
The stock’s price with a change of about 3% and below it represents the worst 16% of projected outcomes.
Conclusion:
There should be a change of about 3% increase for it to be the worst 16% of projected outcomes..
(d)
To explain: If it is an unlikely event to expect a 20% increase in this stock’s price.
It is surprising or unlikely to find out the projected return of increase is about 20%..
Concept used:
According to , the empirical rule about 99.7% of data lie within three standard deviations of the mean and if any particular value has a Z score more than 3 or less than -3, then it is less very likely to occur or unusual.
Calculation:
The given percentage increase 20%, Z score is calculated as shown below
Interpretation:
The Z score of percentage increase of 20%. is 3.25, so it is 3.25 standard deviations more than the mean. According to the empirical rule, about 99.7% of the data lie within three standard deviations of the mean. Thus the likelihood of a stock price increase by 20% is very less. Thus it is foolish to consider a 20% increase in the stock’s price.
Chapter 10 Solutions
PRECALCULUS:GRAPHICAL,...-NASTA ED.

 Calculus: Early TranscendentalsCalculusISBN:9781285741550Author:James StewartPublisher:Cengage Learning
 Thomas' Calculus (14th Edition)CalculusISBN:9780134438986Author:Joel R. Hass, Christopher E. Heil, Maurice D. WeirPublisher:PEARSON
 Calculus: Early Transcendentals (3rd Edition)CalculusISBN:9780134763644Author:William L. Briggs, Lyle Cochran, Bernard Gillett, Eric SchulzPublisher:PEARSON
 Calculus: Early TranscendentalsCalculusISBN:9781319050740Author:Jon Rogawski, Colin Adams, Robert FranzosaPublisher:W. H. Freeman
 Calculus: Early Transcendental FunctionsCalculusISBN:9781337552516Author:Ron Larson, Bruce H. EdwardsPublisher:Cengage Learning