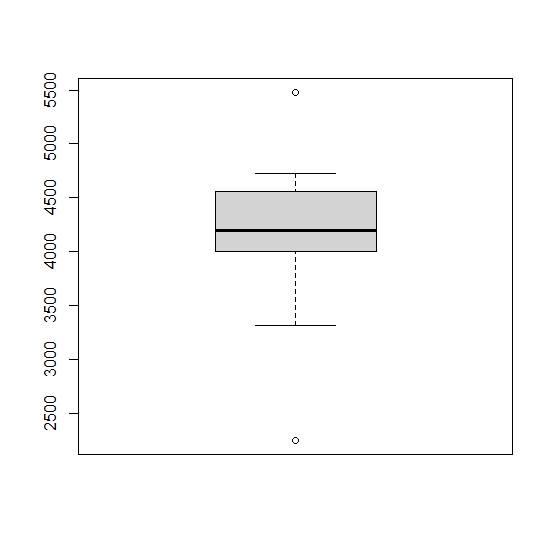
The boxplot of the passage yards data and identify the outliers present in the data.
The boxplot is:

There are two outliers present in the data.
Given information:
The passing yardage of Peyton Manning for 13 seasons as Colt and 4 as a Bronco.
| Year | Yard |
| 1998 | 3739 |
| 1999 | 4135 |
| 2000 | 3313 |
| 2001 | 4131 |
| 2002 | 4200 |
| 2003 | 4267 |
| 2004 | 4557 |
| 2005 | 3747 |
| 2006 | 4397 |
| 2007 | 4040 |
| 2008 | 4002 |
| 2009 | 4500 |
| 2010 | 4700 |
| 2011 | Injured |
| 2012 | 4659 |
| 2013 | 5477 |
| 2014 | 4727 |
| 2015 | 2249 |
Concept Used:
The boxplot is created in the following steps:
Step 1: Arrange the data in ascending order.
Step 2: Compute the quartiles of the data as
Step 3: Consider the data on y-axis and plot the quartiles to obtain the box.
Step 4: Now compute the lower limit and upper limit to find the length of whiskers as follows,
Step 5: Plot the limits and connect the points with the box obtained using the quartiles.
Plot:
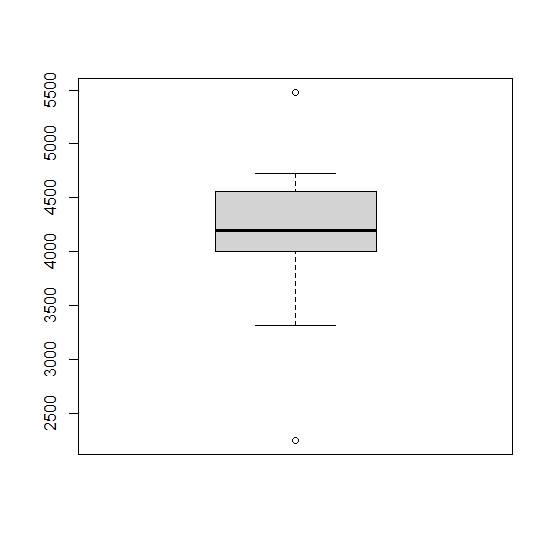
The boxplot created using the above steps is:

Outliers:
The data points that lie outside the whiskers on both sides are identified as outliers. Here,
Chapter 10 Solutions
PRECALCULUS:GRAPHICAL,...-NASTA ED.
 Calculus: Early TranscendentalsCalculusISBN:9781285741550Author:James StewartPublisher:Cengage Learning
 Thomas' Calculus (14th Edition)CalculusISBN:9780134438986Author:Joel R. Hass, Christopher E. Heil, Maurice D. WeirPublisher:PEARSON
 Calculus: Early Transcendentals (3rd Edition)CalculusISBN:9780134763644Author:William L. Briggs, Lyle Cochran, Bernard Gillett, Eric SchulzPublisher:PEARSON
 Calculus: Early TranscendentalsCalculusISBN:9781319050740Author:Jon Rogawski, Colin Adams, Robert FranzosaPublisher:W. H. Freeman
 Calculus: Early Transcendental FunctionsCalculusISBN:9781337552516Author:Ron Larson, Bruce H. EdwardsPublisher:Cengage Learning


