
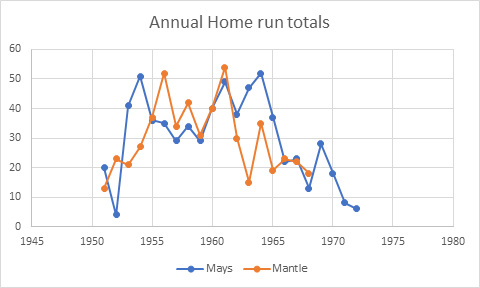
To draw : The time plots to compare the performances of Mays and Mantle.
Given information :
Regular Season Home Run Statistics for Willie Mays, Mickey Mantle, and Hank Aaron is:
Graph :
Interpretation :
Here, both players scores low home runs at the beginning and at the end of their careers, but they scored the most home runs in the middle of their careers.
Also, it can be shown that the Mantle performed better in the years 1951,1954,1955,1996 to 1965 and 1967 than Mays, while Mays performed better than Mantle in other years.
Chapter 10 Solutions
PRECALCULUS:GRAPHICAL,...-NASTA ED.

- (3) (20 points) Let F(x, y, z) = (y, z, x²z). Define E = {(x, y, z) | x² + y² ≤ z ≤ 1, x ≤ 0}. (a) (2 points) Calculate the divergence V. F. (b) (4 points) Let D = {(x, y) | x² + y² ≤ 1, x ≤ 0} Without calculation, show that the triple integral √ (V · F) dV = √ 2²(1. = x²(1 − x² - y²) dA. Earrow_forward(2) (22 points) Let F(x, y, z) = (x sin y, cos y, ―xy). (a) (2 points) Calculate V. F. (b) (6 points) Given a vector field is everywhere defined with V G₁(x, y, z) = * G2(x, y, z) = − G3(x, y, z) = 0. 0 0 F(x, y, z) = (F₁(x, y, z), F₂(x, y, z), F(x, y, z)) that F = 0, let G = (G1, G2, G3) where F₂(x, y, y, t) dt - √ F³(x, t, 0) dt, * F1(x, y, t) dt, t) dt - √ F Calculate G for the vector field F(x, y, z) = (x sin y, cos y, -xy).arrow_forwardEvaluate the following integral over the Region R. (Answer accurate to 2 decimal places). √ √(x + y) A R R = {(x, y) | 25 < x² + y² ≤ 36, x < 0} Hint: The integral and Region is defined in rectangular coordinates.arrow_forward
- Find the volume of the solid that lies under the paraboloid z = 81 - x² - y² and within the cylinder (x − 1)² + y² = 1. A plot of an example of a similar solid is shown below. (Answer accurate to 2 decimal places). Volume using Double Integral Paraboloid & Cylinder -3 Hint: The integral and region is defined in polar coordinates.arrow_forwardEvaluate the following integral over the Region R. (Answer accurate to 2 decimal places). √4(1–2² 4(1 - x² - y²) dA R 3 R = {(r,0) | 0 ≤ r≤ 2,0π ≤0≤¼˜}. Hint: The integral is defined in rectangular coordinates. The Region is defined in polar coordinates.arrow_forwardEvaluate the following integral over the Region R. (Answer accurate to 2 decimal places). R - 1 · {(r,0) | 1 ≤ r≤ 5,½π≤ 0<1π}. Hint: Be sure to convert to Polar coordinates. Use the correct differential for Polar Coordinates.arrow_forward
- Evaluate the following integral over the Region R. (Answer accurate to 2 decimal places). √ √2(x+y) dA R R = {(x, y) | 4 < x² + y² < 25,0 < x} Hint: The integral and Region is defined in rectangular coordinates.arrow_forwardHW: The frame shown in the figure is pinned at A and C. Use moment distribution method, with and without modifications, to draw NFD, SFD, and BMD. B I I 40 kN/m A 3 m 4 marrow_forwardLet the region R be the area enclosed by the function f(x)= = 3x² and g(x) = 4x. If the region R is the base of a solid such that each cross section perpendicular to the x-axis is an isosceles right triangle with a leg in the region R, find the volume of the solid. You may use a calculator and round to the nearest thousandth. y 11 10 9 00 8 7 9 5 4 3 2 1 -1 -1 x 1 2arrow_forward
- Let the region R be the area enclosed by the function f(x) = ex — 1, the horizontal line y = -4 and the vertical lines x = 0 and x = 3. Find the volume of the solid generated when the region R is revolved about the line y = -4. You may use a calculator and round to the nearest thousandth. 20 15 10 5 y I I I | I + -1.5 -1 -0.5 0.5 1 1.5 2 2.5 3 -5 I -10 -15 I + I I T I I + -20 I + -25 I I I -30 I 3.5 4 xarrow_forwardplease show all the workarrow_forwardplease show all the workarrow_forward
 Calculus: Early TranscendentalsCalculusISBN:9781285741550Author:James StewartPublisher:Cengage Learning
 Thomas' Calculus (14th Edition)CalculusISBN:9780134438986Author:Joel R. Hass, Christopher E. Heil, Maurice D. WeirPublisher:PEARSON
 Calculus: Early Transcendentals (3rd Edition)CalculusISBN:9780134763644Author:William L. Briggs, Lyle Cochran, Bernard Gillett, Eric SchulzPublisher:PEARSON
 Calculus: Early TranscendentalsCalculusISBN:9781319050740Author:Jon Rogawski, Colin Adams, Robert FranzosaPublisher:W. H. Freeman
 Calculus: Early Transcendental FunctionsCalculusISBN:9781337552516Author:Ron Larson, Bruce H. EdwardsPublisher:Cengage Learning