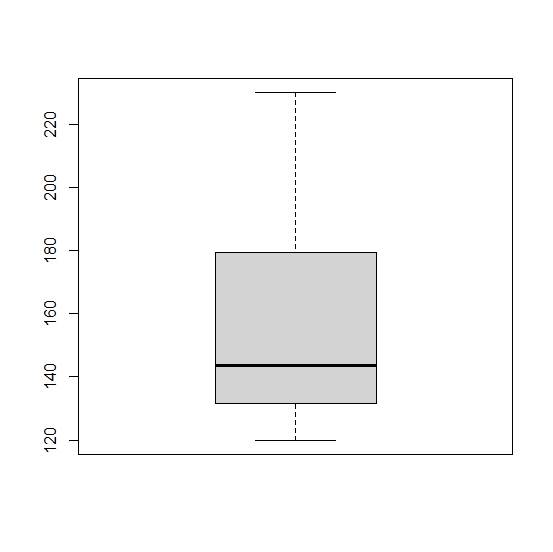
To Create: The boxplot of the length of songs data and identify the outliers present in the data.
The boxplot is:

There are no outliers present in the data.
Given information:
The length (in seconds) of the songs is as follows:
| Length |
| 120 |
| 120 |
| 124 |
| 124 |
| 131 |
| 131 |
| 132 |
| 136 |
| 137 |
| 139 |
| 140 |
| 143 |
| 144 |
| 148 |
| 156 |
| 163 |
| 177 |
| 179 |
| 180 |
| 190 |
| 191 |
| 197 |
| 202 |
| 230 |
Concept Used:
The boxplot is created in the following steps:
Step 1: Arrange the data in ascending order.
Step 2: Compute the quartiles of the data as
Step 3: Consider the data on y-axis and plot the quartiles to obtain the box.
Step 4: Now compute the lower limit and upper limit to find the length of whiskers as follows,
Step 5: Plot the limits and connect the points with the box obtained using the quartiles.
Plot:
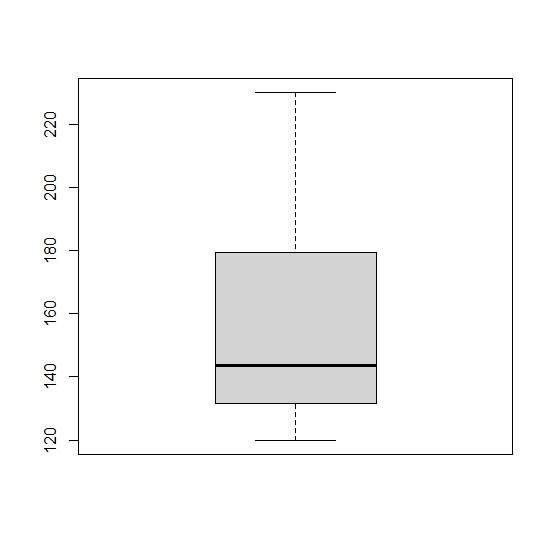
The boxplot created using the above steps is:
Here
The five-number summary is

Outliers:
There are no data points lying outside the whiskers of the boxplot. So there are no outliers present in the length of the songs data.
Chapter 10 Solutions
PRECALCULUS:GRAPHICAL,...-NASTA ED.
- i need help please . and please dont use chat gpt i am trying to learn and see the mistake i did when solving minearrow_forwardThe radius of a sphere decreases at a rate of 3 m/s. Find the rate at which the surface area decreases when the radius is 8 m. Answer exactly or round to 2 decimal places. The surface area decreases at a rate of m²/sarrow_forwardi need help pleasearrow_forward
- (#1) Consider the solid bounded below by z = x² and above by z = 4-y². If we were to project this solid down onto the xy-plane, you should be able to use algebra to determine the 2D region R in the xy-plane for the purposes of integration. Which ONE of these limite of integration would correctly describe R? (a) y: x24x: -22 - (b) y: 22 x: 04-y² (c) y: -√√4-x2. →√√4x²x: −2 → 2 (d) z: 24-y² y: -2 → 2 (e) None of the abovearrow_forwardX MindTap - Cenxxxx Answered: tat "X A 26308049 X 10 EKU-- SP 25: X E DNA Sequenc X b/ui/evo/index.html?elSBN=9780357038406&id=339416021&snapshotid=877369& GE MINDTAP , Limits, and the Derivative 40. Answer 5 4-5 t-10 5 f(x) = 2x - 4 if x ≤0 if x 0 10 ++ -4-3-2-1 f(x) = MacBook Pro Search or type URL 5 1234 x² +1 if x = 0 if x = 0 +arrow_forwardMindTap - Cemy X Answered: tat x A 26308049 × 10 EKU--SP 25:11 × E DNA Sequence x H. pylori index.html?elSBN=9780357038406&id=339416021&snapshotid=877369& NDTAP and the Derivative 41. 42. Answer 12 Ay 5 + -10-5 5 10 -5- f(x) = x +5 if x ≤ 0 -x²+5 if x > 0 to -5 5. 5 f(x) = |x − 1| MacBook Pro AAarrow_forward
- Mind Tap - Cenxxx Answered: tat X A 26308049 × 10 EKU-- SP 25: X E DNA Sequence x H. pylor vo/index.html?elSBN=9780357038406&id=339416021&snapshotld=877369& MINDTAP its, and the Derivative 44. Answer 5 X -10-5 5 10 -5. f(x) = 2 + x +5 if x 0 3 4 f(x) = x² - 1 x+1 if x = -1 MacBook Pro G Search or type URL if x = -1 + AA aarrow_forwardCalculus lll May I please have an explanation of the multivariable chain rule in the example given? Thank youarrow_forwardMind Tap - Cenxxx Answered: tat X A 26308049 X 10 EKU-- SP 25:1 x E DNA Sequence x H. pyl /nb/ui/evo/index.html?elSBN 9780357038406&id=339416021&snapshotid=877369& ⭑ SAGE MINDTAP a ons, Limits, and the Derivative 吃 AA In Exercises 45, 46, 47, 48, 49, 50, 51, 52, 53, 54, 55, and 56, find the values of x for which each function is continuous. 45. f(x) = 2x²+x-1 Answer▾ 46. f(x) = x³- 2x²+x-1 47. f(x) 2 = x²+1 Answer 48. f(x) = 49. f(x) = Answer 50. f(x) = 51. f(x) = I 2x²+1 2 2x - 1 x+1 x-1 2x + 1 x²+x-2 Answer↓ 52. f(x)= = x-1 x2+2x-3 53. $ % MacBook Proarrow_forward
 Calculus: Early TranscendentalsCalculusISBN:9781285741550Author:James StewartPublisher:Cengage Learning
 Thomas' Calculus (14th Edition)CalculusISBN:9780134438986Author:Joel R. Hass, Christopher E. Heil, Maurice D. WeirPublisher:PEARSON
 Calculus: Early Transcendentals (3rd Edition)CalculusISBN:9780134763644Author:William L. Briggs, Lyle Cochran, Bernard Gillett, Eric SchulzPublisher:PEARSON
 Calculus: Early TranscendentalsCalculusISBN:9781319050740Author:Jon Rogawski, Colin Adams, Robert FranzosaPublisher:W. H. Freeman
 Calculus: Early Transcendental FunctionsCalculusISBN:9781337552516Author:Ron Larson, Bruce H. EdwardsPublisher:Cengage Learning


