a.
To describe: The shape of the distribution.
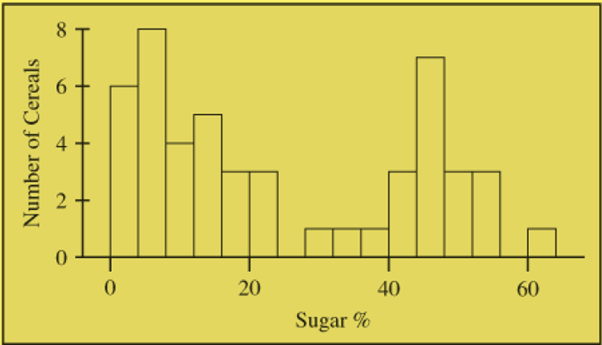
The shape of the distribution is Bimodal.
Given:
The histogram shows the sugar content (as a percent of weight) of 49 brands of breakfast cereals:

Calculation:
There are two peaks in the given histogram, one peak centered at about 5 and another peak centered about 45.
Conclusion:
The shape of the distribution is Bimodal.
b.
To describe: The reason for the shape of the histogram.
The cereals can be classified as low as well as high sugar content.
Given:
The salaries of the workers in one department of the Garcia Brothers Company (given in thousands of dollars) are as follows:
Calculation:
From part
The two peaks originate from the fact that most cereals either have low sugar content(5%) or high sugar content(45%).
Thus, the cereals can be classified as low as well as high sugar content.
Conclusion:
The cereals can be classified as low as well as high sugar content.
Chapter 10 Solutions
PRECALCULUS:GRAPHICAL,...-NASTA ED.
- Let the region R be the area enclosed by the function f(x)= = 3x² and g(x) = 4x. If the region R is the base of a solid such that each cross section perpendicular to the x-axis is an isosceles right triangle with a leg in the region R, find the volume of the solid. You may use a calculator and round to the nearest thousandth. y 11 10 9 00 8 7 9 5 4 3 2 1 -1 -1 x 1 2arrow_forwardLet the region R be the area enclosed by the function f(x) = ex — 1, the horizontal line y = -4 and the vertical lines x = 0 and x = 3. Find the volume of the solid generated when the region R is revolved about the line y = -4. You may use a calculator and round to the nearest thousandth. 20 15 10 5 y I I I | I + -1.5 -1 -0.5 0.5 1 1.5 2 2.5 3 -5 I -10 -15 I + I I T I I + -20 I + -25 I I I -30 I 3.5 4 xarrow_forwardplease show all the workarrow_forward
 Calculus: Early TranscendentalsCalculusISBN:9781285741550Author:James StewartPublisher:Cengage Learning
 Thomas' Calculus (14th Edition)CalculusISBN:9780134438986Author:Joel R. Hass, Christopher E. Heil, Maurice D. WeirPublisher:PEARSON
 Calculus: Early Transcendentals (3rd Edition)CalculusISBN:9780134763644Author:William L. Briggs, Lyle Cochran, Bernard Gillett, Eric SchulzPublisher:PEARSON
 Calculus: Early TranscendentalsCalculusISBN:9781319050740Author:Jon Rogawski, Colin Adams, Robert FranzosaPublisher:W. H. Freeman
 Calculus: Early Transcendental FunctionsCalculusISBN:9781337552516Author:Ron Larson, Bruce H. EdwardsPublisher:Cengage Learning


