
Concept explainers
Videos
(a)
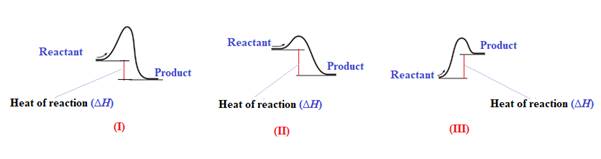
Interpretation: The heat of the reaction on each diagram is to be labeled.
Concept introduction:When a reaction occurs, some bond formed and some bonds are broken. Every reaction goes through the intermediate stage. The intermediate is very unstable and therefore have highest energy.The diagram which represents the relative energy of reactant, product, and transition state is termed as energy diagram.
(a)
Answer to Problem 5E
The heat of the reaction

Explanation of Solution
The given energy diagram is shown below:

The heat of a reaction
(b)
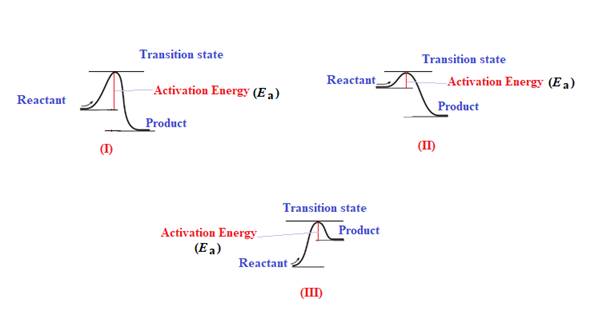
Interpretation: The activation energy on each diagram is to be labeled.
Concept introduction: When a reaction occurs, some bond formed and some bonds are broken. Every reaction goes through the intermediate stage. The intermediate is very unstable and therefore have highest energy. The diagram which represents the relative energy of reactant, product, and transition state is termed as energy diagram.
(b)
Answer to Problem 5E
The activation energy

Explanation of Solution
The given energy diagram is shown below:
The energy required to reach a reactant to its transition state is termed as activation energy
(c)
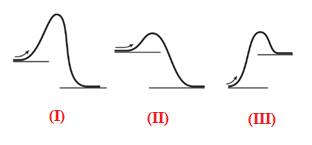
Interpretation: The diagram which represents the most exothermic reaction is to be predicted.
Concept introduction: When a reaction occurs, some bond formed and some bonds are broken. Every reaction goes through the intermediate stage. The intermediate is very unstable and therefore have highest energy. The diagram which represents the relative energy of reactant, product, and transition state is termed as energy diagram.
(c)
Answer to Problem 5E
The diagram which represents the most exothermic reaction is shown below:

Explanation of Solution
The given energy diagram is shown below:

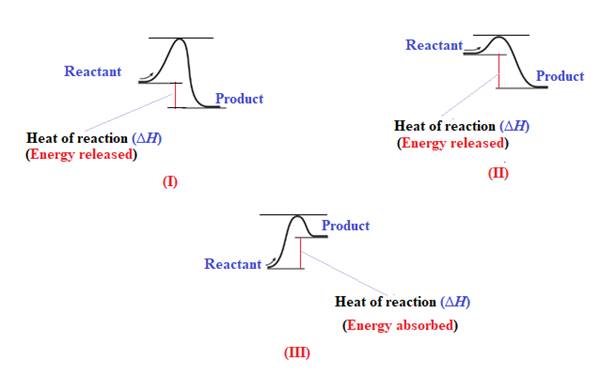
The reaction in which the energy of the product is less than the energy of reactant is termed as exothermic reaction. In an exothermic reaction, energy releases.In diagram (I) and (II), the energy of energy of the product is less than the energy of reactant. Therefore, diagram (I) and (II)represents exothermic reaction as shown below:

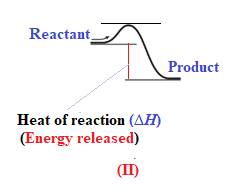
In diagram (II), the difference in the energy is more. Therefore, diagram (II) represents most exothermic reaction as shown below:
(d)
Interpretation: The reaction which requires energy to get started is to be predicted.
Concept introduction: When a reaction occurs, some bond formed and some bonds are broken. Every reaction goes through the intermediate stage. The intermediate is very unstable and therefore have highest energy. The diagram which represents the relative energy of reactant, product, and transition state is termed as energy diagram.
(d)
Answer to Problem 5E
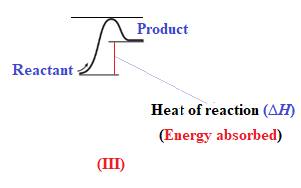
Endothermic reaction requires energy to get started. Diagram (III) represents the endothermic reaction as shown below:
Explanation of Solution
The given energy diagram is shown below:

The reaction in which the energy of the product is more than the energy of reactant is termed as endothermic reaction. In an endothermic reaction, energy absorbs. In diagram (III), the energy of energy of the product is more than the energy of reactant. Therefore, diagram (III) represents an endothermic reaction as shown below:
It is known that endothermic reaction requires energy to get started. Therefore, diagram (III) is represents the endothermic reaction as shown below:

Chapter U5 Solutions
Living By Chemistry: First Edition Textbook
Additional Science Textbook Solutions
Human Physiology: An Integrated Approach (8th Edition)
Microbiology: An Introduction
Anatomy & Physiology (6th Edition)
Campbell Essential Biology with Physiology (5th Edition)
Chemistry (7th Edition)
Microbiology: An Introduction


- Using iodometry I want to titrate a sodium thiosulfate solution and I use 15 mL. If I have 50 mL of a 0.90 M copper solution and KI, what will be the molarity of sodium thiosulfate?arrow_forwardDraw the product formed when the following pair of compounds is treated with NaOEt in ethanol. + i CNarrow_forwardI need help with the followingarrow_forward
- I need help with the followingarrow_forwardFor Raman spectroscopy/imaging, which statement is not true regarding its disadvantages? a) Limited spatial resolution. b) Short integration time. c) A one-dimensional technique. d) Weak signal, only 1 in 108 incident photons is Raman scattered. e) Fluorescence interference.arrow_forwardUsing a cell of known pathlength b = 1.25115 x 10⁻³ cm, a water absorption spectrum was measured. The band at 1645 cm-1, assigned to the O-H bending, showed an absorbance, A, of 1.40. a) Assuming that water density is 1.00 g/mL, calculate the water molar concentration c (hint: M= mole/L) b) Calculate the molar absorptivity, a, of the 1645 cm-1 band c) The transmitted light, I, can be written as I= Ioexp(-xb), where x is the absorption coefficient (sometimes designated as alpha), Io is the input light, and b is the cell pathlength. Prove that x= (ln10)*x*c. (Please provide a full derivation of the equation for x from the equation for I). d) Calculate x for the 1645 cm-1 bandarrow_forward
 ChemistryChemistryISBN:9781305957404Author:Steven S. Zumdahl, Susan A. Zumdahl, Donald J. DeCostePublisher:Cengage Learning
 ChemistryChemistryISBN:9781259911156Author:Raymond Chang Dr., Jason Overby ProfessorPublisher:McGraw-Hill Education
 Principles of Instrumental AnalysisChemistryISBN:9781305577213Author:Douglas A. Skoog, F. James Holler, Stanley R. CrouchPublisher:Cengage Learning
 Organic ChemistryChemistryISBN:9780078021558Author:Janice Gorzynski Smith Dr.Publisher:McGraw-Hill Education
 Chemistry: Principles and ReactionsChemistryISBN:9781305079373Author:William L. Masterton, Cecile N. HurleyPublisher:Cengage Learning
 Elementary Principles of Chemical Processes, Bind...ChemistryISBN:9781118431221Author:Richard M. Felder, Ronald W. Rousseau, Lisa G. BullardPublisher:WILEY