
Videos
National Debt The size of the total debt owed by the United States federal government continues to grow. In fact, according to the Department of the Treasury, the debt per person living in the United States is approximately
Plot the points
Draw a line segment from the point
Find the average rate of change of the debt from
Find the average rate of change of the debt from
Find the average rate of change of the debt from
What appears to be happening to the average rate of change as time passes?
(a)
To graph: The points
Explanation of Solution
Given Information:
The following data represents the U.S debt for the years
Graph:
To plot the points
The point
Similarly, all the remaining points represent the debt in billions of dollars for each year from
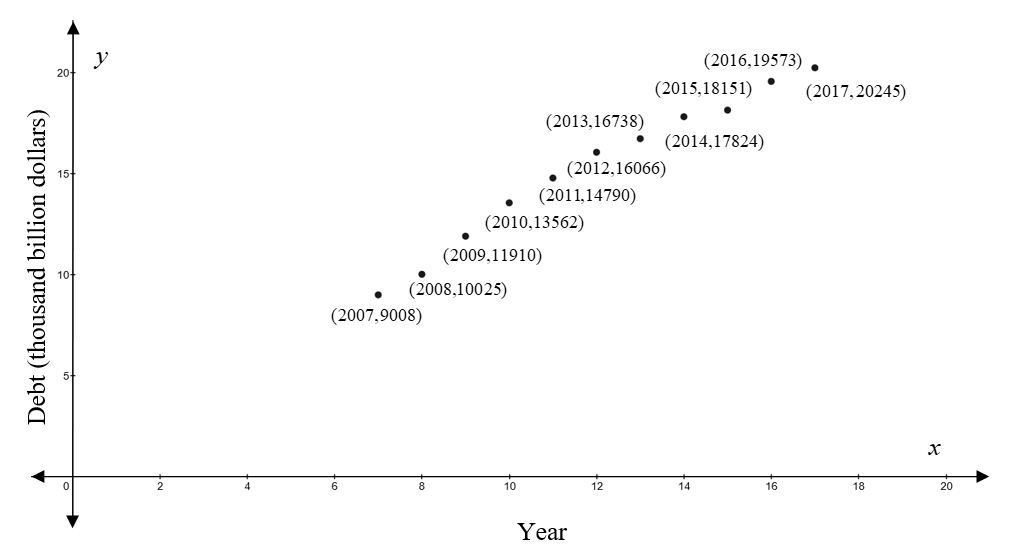
Interpretation:
The graph shows that the cost of U.S. debt increases each year from
(b)
To graph: The line segment from the points
Explanation of Solution
Given Information:
The following data represents the U.S. debt for the years
Graph:
The
The point
Similarly, the point
To draw the line segment from
First, find the slope of line segment passing though the points
Here,
Therefore, slope of line segment from point
To draw the line segment, first find the equation of line by using the point-slope formula,
Here,
Therefore,
The line segment from the points
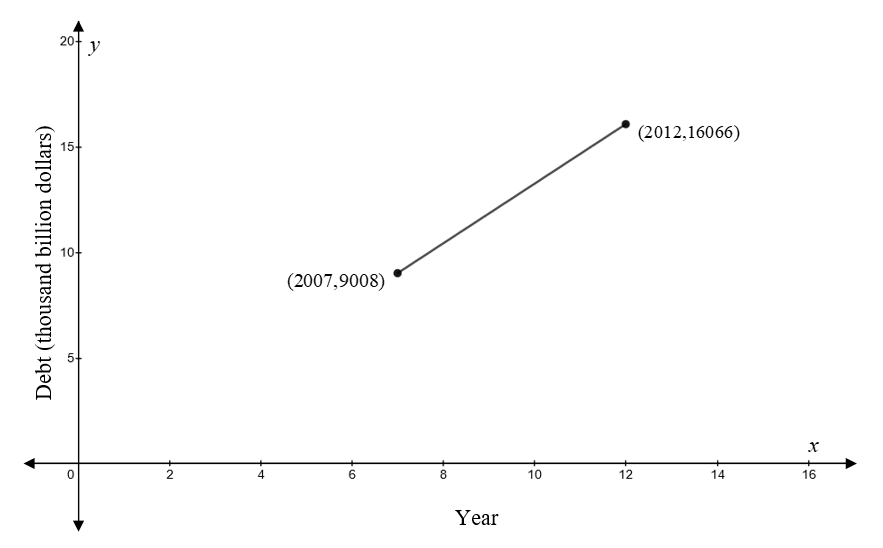
That means the slope of line segment from point
That is, the debt in U.S. increases from year
Interpretation:
The slope of the line segment from point
(c)
To calculate: The average rate of change of the debt fromyear
Answer to Problem 78AYU
Solution:
The average rate of change of the debt from
Explanation of Solution
Given Information:
The following data represents the U.S debt for the years
Formula used:
The average rate of change of function
Average rate of change
Calculation:
The average rate of change of the debt from
From the table,
Therefore, the average rate of change of the debt from
(d)
To calculate: The average rate of change of the debt fromyear
Answer to Problem 78AYU
Solution:
The average rate of change of the debt from
Explanation of Solution
Given Information:
The following data represents the U.S debt for the years
Formula used:
The average rate of change of function
Average rate of change
Calculation:
The average rate of change of the debt from
Average rate of change
From the table,
Therefore, average rate of change
Therefore, the average rate of change of the debt from
(e)
To calculate: The average rate of change of the debt from
Answer to Problem 78AYU
Solution:
The average rate of change of the debt from
Explanation of Solution
Given Information:
The following data represents the U.S debt for the years
Formula used:
The average rate of change of function
Average rate of change
Calculation:
The average rate of change of the debt from
Average rate of change
From the table,
Average rate of change
Therefore, the average rate of change of the debt from
(f)
The effect on average rate of change as the time passes.
Answer to Problem 78AYU
Solution:
As time passes, the average rate of change of debt first increases and then decreases.
Explanation of Solution
Given Information:
The following data represents the U.S debt for the years
Explanation:
The average rate of change of function
Average rate of change
From part (b), the slope of line segment from
From part (c), the average rate of change of the debt from
From part (d), the average rate of change of the debt from
From part (e), the average rate of change of the debt from
This shows that as time passes, the average rate of change of debt first increases and then decreases.
Chapter 2 Solutions
Precalculus
Additional Math Textbook Solutions
Elementary Statistics: Picturing the World (7th Edition)
Intro Stats, Books a la Carte Edition (5th Edition)
Pre-Algebra Student Edition
University Calculus: Early Transcendentals (4th Edition)
Calculus: Early Transcendentals (2nd Edition)


- please solve with full steps pleasearrow_forward4. Identify at least two mistakes in Francisco's work. Correct the mistakes and complete the problem by using the second derivative test. 2f 2X 2. Find the relative maximum and relative minimum points of f(x) = 2x3 + 3x² - 3, using the First Derivative Test or the Second Derivative Test. bx+ bx 6x +6x=0 12x- af 24 = 0 x=0 108 -2 5. Identify at least three mistakes in Francisco's work. Then sketch the graph of the function and label the local max and local min. 1. Find the equation of the tangent line to the curve y=x-2x3+x-2 at the point (1.-2). Sketch the araph of y=x42x3+x-2 and the tangent line at (1,-2) y' = 4x-6x y' (1) = 4(1) - 667 - 2 = 4(-2)4127-6(-2) 5-8-19-20 =arrow_forward۳/۱ R2X2 2) slots per pole per phase = 3/31 B=18060 msl Ka, Sin (1) Kdl Isin ( sin(30) Sin (30) اذا ميريد شرح الكتب بس 0 بالفراغ 3) Cos (30) 0.866 4) Rotating 120*50 5) Synchronous speed, 120 x 50 S1000-950 1000 Copper losses 5kw 50105 Rotor input 5 0.05 loo kw 6) 1 1000rpm اذا ميريد شرح الكتب فقط Look = 7) rotov DC ined sove in peaper PU + 96er Which of the following is converge, and which diverge? Give reasons for your answers with details. When your answer then determine the convergence sum if possible. 3" 6" Σ=1 (2-1) π X9arrow_forward
- 1 R2 X2 2) slots per pole per phase = 3/31 B = 180 - 60 msl Kd Kol, Sin (no) Isin (6) 2 sin(30) Sin (30) اذا ميريد شرح الكتب بس 0 بالفراغ 3) Cos (30) 0.866 4) Rotating 5) Synchronous speed; 120*50 Looo rem G S = 1000-950 solos 1000 Copper losses: 5kw Rotor input: 5 loo kw 0.05 1 اذا میرید شرح الكتب فقط look 7) rotor DC ined sove in pea PU+96er Q2// Find the volume of the solid bounded above by the cynnuer 2=6-x², on the sides by the cylinder x² + y² = 9, and below by the xy-plane. Q041 Convert 2 2x-2 Lake Gex 35 w2x-xབོ ,4-ཙཱཔ-y √4-x²-yz 21xy²dzdydx to(a) cylindrical coordinates, (b) Spherical coordinates. 201 25arrow_forwardshow full work pleasearrow_forward3. Describe the steps you would take to find the absolute max of the following function using Calculus f(x) = : , [-1,2]. Then use a graphing calculator to x-1 x²-x+1 approximate the absolute max in the closed interval.arrow_forward
- (7) (12 points) Let F(x, y, z) = (y, x+z cos yz, y cos yz). Ꮖ (a) (4 points) Show that V x F = 0. (b) (4 points) Find a potential f for the vector field F. (c) (4 points) Let S be a surface in R3 for which the Stokes' Theorem is valid. Use Stokes' Theorem to calculate the line integral Jos F.ds; as denotes the boundary of S. Explain your answer.arrow_forward(3) (16 points) Consider z = uv, u = x+y, v=x-y. (a) (4 points) Express z in the form z = fog where g: R² R² and f: R² → R. (b) (4 points) Use the chain rule to calculate Vz = (2, 2). Show all intermediate steps otherwise no credit. (c) (4 points) Let S be the surface parametrized by T(x, y) = (x, y, ƒ (g(x, y)) (x, y) = R². Give a parametric description of the tangent plane to S at the point p = T(x, y). (d) (4 points) Calculate the second Taylor polynomial Q(x, y) (i.e. the quadratic approximation) of F = (fog) at a point (a, b). Verify that Q(x,y) F(a+x,b+y). =arrow_forward(6) (8 points) Change the order of integration and evaluate (z +4ry)drdy . So S√ ² 0arrow_forward
- (10) (16 points) Let R>0. Consider the truncated sphere S given as x² + y² + (z = √15R)² = R², z ≥0. where F(x, y, z) = −yi + xj . (a) (8 points) Consider the vector field V (x, y, z) = (▼ × F)(x, y, z) Think of S as a hot-air balloon where the vector field V is the velocity vector field measuring the hot gasses escaping through the porous surface S. The flux of V across S gives the volume flow rate of the gasses through S. Calculate this flux. Hint: Parametrize the boundary OS. Then use Stokes' Theorem. (b) (8 points) Calculate the surface area of the balloon. To calculate the surface area, do the following: Translate the balloon surface S by the vector (-15)k. The translated surface, call it S+ is part of the sphere x² + y²+z² = R². Why do S and S+ have the same area? ⚫ Calculate the area of S+. What is the natural spherical parametrization of S+?arrow_forward(1) (8 points) Let c(t) = (et, et sint, et cost). Reparametrize c as a unit speed curve starting from the point (1,0,1).arrow_forward(9) (16 points) Let F(x, y, z) = (x² + y − 4)i + 3xyj + (2x2 +z²)k = - = (x²+y4,3xy, 2x2 + 2²). (a) (4 points) Calculate the divergence and curl of F. (b) (6 points) Find the flux of V x F across the surface S given by x² + y²+2² = 16, z ≥ 0. (c) (6 points) Find the flux of F across the boundary of the unit cube E = [0,1] × [0,1] x [0,1].arrow_forward
 Calculus: Early TranscendentalsCalculusISBN:9781285741550Author:James StewartPublisher:Cengage Learning
 Thomas' Calculus (14th Edition)CalculusISBN:9780134438986Author:Joel R. Hass, Christopher E. Heil, Maurice D. WeirPublisher:PEARSON
 Calculus: Early Transcendentals (3rd Edition)CalculusISBN:9780134763644Author:William L. Briggs, Lyle Cochran, Bernard Gillett, Eric SchulzPublisher:PEARSON
 Calculus: Early TranscendentalsCalculusISBN:9781319050740Author:Jon Rogawski, Colin Adams, Robert FranzosaPublisher:W. H. Freeman
 Calculus: Early Transcendental FunctionsCalculusISBN:9781337552516Author:Ron Larson, Bruce H. EdwardsPublisher:Cengage Learning