
Concept explainers
Videos
In Problems 57-64, use a graphing utility to graph each function over the indicated interval and approximate any
63.
To find: The following values using the given graph,
a. Draw the graph using graphing utility and determine the local maximum and minimum values.
Answer to Problem 59AYU
a. Local maximum point are and and local minimum is .
Explanation of Solution
Given:
It is asked to draw the graph using graphing utility and determine the local maximum and minimum values and also the increasing and decreasing intervals of the given function.
Calculation:
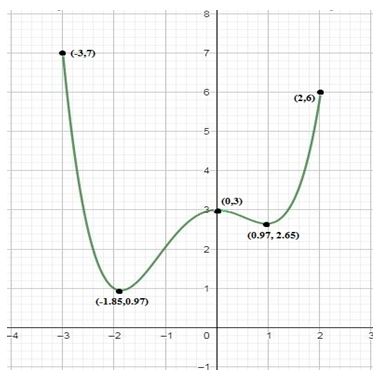
a. By the definition of local maximum, “Let be a function defined on some interval . A function has a local maximum at if there is an open interval containing so that, for all in this open interval, we have . We call a local maximum value of ”, It can be directly concluded from the graph and the definition that the curve has local maximum point at and .
The value of the local maximum at is and is .
Therefore, the local maximum points are and .
By the definition of local minimum, “Let be a function defined on some interval . A function has a local minimum at if there is an open interval containing so that, for all in this open interval, we have . We call a local minimum value of ”, It can be directly concluded from the graph and the definition that the curve has local minimum point at .
The value of the local minimum point at is .
Therefore, the local minimum point is .
To find: The following values using the given graph,
b. Increasing and decreasing intervals of the function .
Answer to Problem 59AYU
b. The function is increasing in the interval and , the function is decreasing in the intervals and . There is no constant interval in the given graph.
Explanation of Solution
Given:
It is asked to draw the graph using graphing utility and determine the local maximum and minimum values and also the increasing and decreasing intervals of the given function.
Calculation:
b. Increasing intervals, decreasing intervals and constant interval if any.
It can be directly concluded from the graph that the curve is decreasing from to , then increasing from to 0, then decreasing from 0 to and at last increasing from to 2.
Therefore, the function is increasing in the interval and , the function is decreasing in the intervals and . There is no constant interval in the given graph.
Chapter 2 Solutions
Precalculus
Additional Math Textbook Solutions
A First Course in Probability (10th Edition)
University Calculus: Early Transcendentals (4th Edition)
A Problem Solving Approach To Mathematics For Elementary School Teachers (13th Edition)
College Algebra (7th Edition)
Calculus: Early Transcendentals (2nd Edition)
Pre-Algebra Student Edition


- Consider the function f(x) = x²-1. (a) Find the instantaneous rate of change of f(x) at x=1 using the definition of the derivative. Show all your steps clearly. (b) Sketch the graph of f(x) around x = 1. Draw the secant line passing through the points on the graph where x 1 and x-> 1+h (for a small positive value of h, illustrate conceptually). Then, draw the tangent line to the graph at x=1. Explain how the slope of the tangent line relates to the value you found in part (a). (c) In a few sentences, explain what the instantaneous rate of change of f(x) at x = 1 represents in the context of the graph of f(x). How does the rate of change of this function vary at different points?arrow_forward1. The graph of ƒ is given. Use the graph to evaluate each of the following values. If a value does not exist, state that fact. и (a) f'(-5) (b) f'(-3) (c) f'(0) (d) f'(5) 2. Find an equation of the tangent line to the graph of y = g(x) at x = 5 if g(5) = −3 and g'(5) = 4. - 3. If an equation of the tangent line to the graph of y = f(x) at the point where x 2 is y = 4x — 5, find ƒ(2) and f'(2).arrow_forwardDoes the series converge or divergearrow_forward
- Suppose that a particle moves along a straight line with velocity v (t) = 62t, where 0 < t <3 (v(t) in meters per second, t in seconds). Find the displacement d (t) at time t and the displacement up to t = 3. d(t) ds = ["v (s) da = { The displacement up to t = 3 is d(3)- meters.arrow_forwardLet f (x) = x², a 3, and b = = 4. Answer exactly. a. Find the average value fave of f between a and b. fave b. Find a point c where f (c) = fave. Enter only one of the possible values for c. c=arrow_forwardplease do Q3arrow_forward
- Use the properties of logarithms, given that In(2) = 0.6931 and In(3) = 1.0986, to approximate the logarithm. Use a calculator to confirm your approximations. (Round your answers to four decimal places.) (a) In(0.75) (b) In(24) (c) In(18) 1 (d) In ≈ 2 72arrow_forwardFind the indefinite integral. (Remember the constant of integration.) √tan(8x) tan(8x) sec²(8x) dxarrow_forwardFind the indefinite integral by making a change of variables. (Remember the constant of integration.) √(x+4) 4)√6-x dxarrow_forward
 Calculus: Early TranscendentalsCalculusISBN:9781285741550Author:James StewartPublisher:Cengage Learning
 Thomas' Calculus (14th Edition)CalculusISBN:9780134438986Author:Joel R. Hass, Christopher E. Heil, Maurice D. WeirPublisher:PEARSON
 Calculus: Early Transcendentals (3rd Edition)CalculusISBN:9780134763644Author:William L. Briggs, Lyle Cochran, Bernard Gillett, Eric SchulzPublisher:PEARSON
 Calculus: Early TranscendentalsCalculusISBN:9781319050740Author:Jon Rogawski, Colin Adams, Robert FranzosaPublisher:W. H. Freeman
 Calculus: Early Transcendental FunctionsCalculusISBN:9781337552516Author:Ron Larson, Bruce H. EdwardsPublisher:Cengage Learning