Concept explainers
(a)
Interpretation : A graph comparing the Celsius scale and Fahrenheit scale is to be created. Also, the freezing point and boiling point of water are to be plotted on the graph.
Concept Introduction :
There are two types of temperature scales, a Celsius scale and a Fahrenheit scale. Celsius scale was created by Andreas Celsius in 1747 and Fahrenheit scale was created by German scientist Daniel Fahrenheit in 1724.
(a)
Answer to Problem 9E
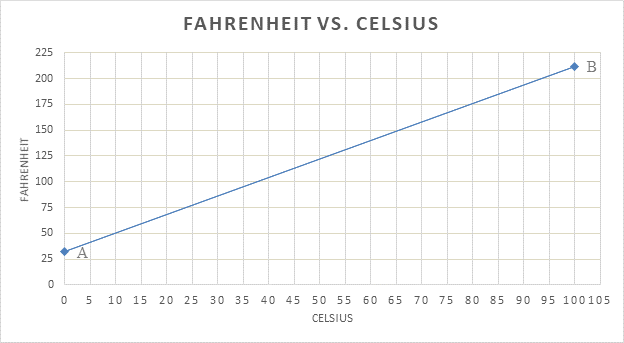
The following graph compares the Celsius scale and Fahrenheit scale:

Point ‘A’ is freezing point of water.
Point ‘B’ is boiling point of water.
Explanation of Solution
A graph can be plotted comparing the Celsius scale and Fahrenheit scale. In Celsius scale the melting temperature of ice is 00C and boiling point of water is 1000C as measured at sea level. On the Fahrenheit scale, the melting temperature of ice is 320F and boiling point of water is 2120F. Hence 00C corresponds to 320F on the graph. This is marked as point ‘A’. 320F corresponds to 1000C and is marked as point ‘B’.
(b)
Interpretation : Using the graph temperature in 0F has to be determined for 100C.
Concept Introduction :
The Celsius scale and Fahrenheit scale graph can be used to convert temperature in degree Celsius to temperature in degree Fahrenheit.
(b)
Answer to Problem 9E

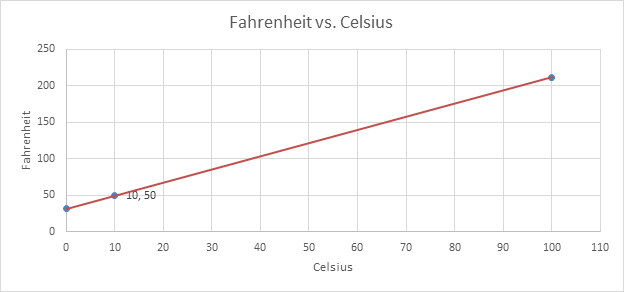
Temperature in 0F for 100C is 500F.
Explanation of Solution
To find out the temperature in 0F for 100C, first draw a vertical line from 10 on Celsius scale (x-axis) up to the red line. From there,draw a horizontal line to reach the corresponding point on Y axis. This is shown by black lines on the graph. The reading on Fahrenheit scale is obtained. In this case it is 500F.
(c)
Interpretation : Using the graph temperature in 0C has to be determined for 550F.
Concept Introduction :
The Celsius scale and Fahrenheit scale graph can be used to convert temperature in degree Fahrenheit totemperature in degree Celsius.
(c)
Answer to Problem 9E

Explanation of Solution
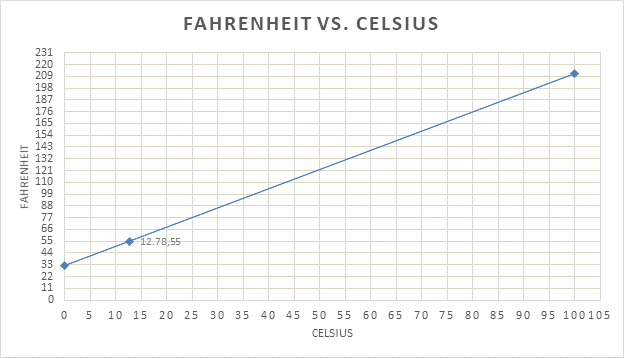
To find out the temperature in 0C for 550F, first draw a horizontal line from 55 on Fahrenheit scale (y-axis) up to the red line. From there, draw a vertical line below to reach the corresponding point on x- axis. This is shown by black lines on the graph. The reading on Celsius scale is obtained. In this case, it is 12.780C.
Chapter U3 Solutions
Living by Chemistry
Additional Science Textbook Solutions
Cosmic Perspective Fundamentals
Biology: Life on Earth (11th Edition)
Campbell Essential Biology (7th Edition)
Human Anatomy & Physiology (2nd Edition)
Anatomy & Physiology (6th Edition)
Campbell Biology: Concepts & Connections (9th Edition)
- Please help me figure out the mechanism with arrows of the following reactionarrow_forwardOrganic Functional Groups Predicting the reactants or products of acetal hydrolysis termine the structures of the missing organic molecules in the following reaction: H* H* + H₂O Y ☑ Note: Molecules that share the same letter have the exact same structure. In the drawing area below, draw the skeletal ("line") structures of the missing organic molecules X, Y, and Z. You may draw that you like, so long as they aren't touching. Molecule X shows up in multiple steps, but you only have to draw its structure Explanation Check @2 W Click and drag to start drawing a structure. #4 # 3 LU E % 67 olo 5 66 R T Y & 7 AcGraw Hill LLC. All Rights R Xarrow_forward8. (16 pts) Provide the stepwise mechanism for the synthesis of the following compound via an enaminearrow_forward
- Draw the titration curve of (i) weak acid vs. strong base; (ii) weak acid vs. weakbase; (iii) diprotic acid with strong base (iii) triprotic acid with strong base.arrow_forwardComplete the reaction in the drawing area below by adding the major products to the right-hand side. If there won't be any products, because nothing will happen under these reaction conditions, check the box under the drawing area instead. Note: if the products contain one or more pairs of enantiomers, don't worry about drawing each enantiomer with dash and wedge bonds. Just draw one molecule to represent each pair of enantiomers, using line bonds at the chiral center. More... No reaction. my ㄖˋ + 1. Na O Me Click and drag to start drawing a structure. 2. H +arrow_forwardPredict the intermediate 1 and final product 2 of this organic reaction: NaOMe H+ + 1 2 H H work up You can draw 1 and 2 in any arrangement you like. Note: if either 1 or 2 consists of a pair of enantiomers, just draw one structure using line bonds instead of 3D (dash and wedge) bonds at the chiral center. Click and drag to start drawing a structure. X $ dmarrow_forward
- Predict the major products of this organic reaction: 1. NaH (20°C) 2. CH3Br ? Some notes: • Draw only the major product, or products. You can draw them in any arrangement you like. • Be sure to use wedge and dash bonds where necessary, for example to distinguish between major products that are enantiomers. • If there are no products, just check the box under the drawing area. No reaction. Click and drag to start drawing a structure. G Crarrow_forwardPredict the major products of this organic reaction: 1. LDA (-78°C) ? 2. Br Some notes: • Draw only the major product, or products. You can draw them in any arrangement you like. . • Be sure to use wedge and dash bonds where necessary, for example to distinguish between major products that are enantiomers. • If there are no products, just check the box under the drawing area. No reaction. Click and drag to start drawing a structure. Xarrow_forwardPlease draw the structuresarrow_forward
- Draw the missing intermediates 1 and 2, plus the final product 3, of this synthesis: 0 1. Eto 1. Eto- 1 2 2. MeBr 2. EtBr H3O+ A 3 You can draw the three structures in any arrangement you like. Explanation Check Click and drag to start drawing a structure.arrow_forwardDraw the missing intermediate 1 and final product 2 of this synthesis: 1. MeO- H3O+ 1 2 2. PrBr Δ You can draw the two structures in any arrangement you like. Click and drag to start drawing a structure.arrow_forwardWhat is the differences between: Glyceride and phosphoglyceride Wax and Fat Soap and Fatty acid HDL and LDL cholesterol Phospho lipids and sphingosine What are the types of lipids? What are the main lipid components of membrane structures? How could lipids play important rules as signaling molecules and building units? The structure variety of lipids makes them to play significant rules in our body, conclude breifly on this statement.arrow_forward
 ChemistryChemistryISBN:9781305957404Author:Steven S. Zumdahl, Susan A. Zumdahl, Donald J. DeCostePublisher:Cengage Learning
 ChemistryChemistryISBN:9781259911156Author:Raymond Chang Dr., Jason Overby ProfessorPublisher:McGraw-Hill Education
 Principles of Instrumental AnalysisChemistryISBN:9781305577213Author:Douglas A. Skoog, F. James Holler, Stanley R. CrouchPublisher:Cengage Learning
 Organic ChemistryChemistryISBN:9780078021558Author:Janice Gorzynski Smith Dr.Publisher:McGraw-Hill Education
 Chemistry: Principles and ReactionsChemistryISBN:9781305079373Author:William L. Masterton, Cecile N. HurleyPublisher:Cengage Learning
 Elementary Principles of Chemical Processes, Bind...ChemistryISBN:9781118431221Author:Richard M. Felder, Ronald W. Rousseau, Lisa G. BullardPublisher:WILEY


