Concept explainers
a.
The interpretation of the given
a.
Answer to Problem 4.6.2.1P
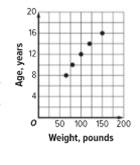
The given scatter is agreeable since the weight of a person increases with age as is depicted in the scatter plot.
Explanation of Solution
Given: The scatter plot showing the relation between the weight and age is as follows-

Concept Used: A scatter plot shows the relationship between a set of data with two variables graphed as ordered pairs on a coordinate plane. A scatter plot determines the
According to the given scatter plot, the weight increases as the age of the person increases. Hence it depicts a
b.
The weight at the age of 40.
b.
Answer to Problem 4.6.2.1P
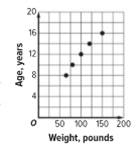
The weight cannot be correctly determined from the line of regression as it will give an unreasonable value.
Explanation of Solution
Given: The scatter plot showing the relation between the weight and age is as follows-

Concept Used: A scatter plot shows the relationship between a set of data with two variables graphed as ordered pairs on a coordinate plane. A scatter plot determines the correlation between the two quantities being plotted. A line of best fit is a line through the scatter plot which is as close to all the points in the plot as possible. The slope of the line of best fit can be found using the formula-
The equation of the line of best fit can help finding the values of one quantity if the value of the other quantity in the scatter plot is known. The equation can be determined using the formula-
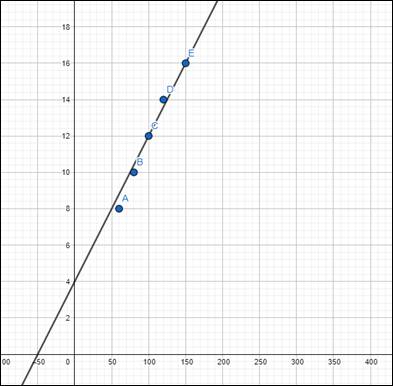
Calculation: For the given scatter plot, the line of best fit is as follows-

Since the line passes through the points
Therefore the equation of the line passing through
When the age is 40 years, the weight can be determined by putting
This is an unreasonable value for the weight of a 40year old person. The reason for getting this absurd result is because unlike real world conditions where the weight after a certain age ceases to increase unreasonably, the line of best fit of the given scatter plot has a positive slope meaning that the weight keeps on increasing as age increases. Thus, the line of regression doesn’t provide a reasonable value of the weight at the age of 40.
Chapter ISG Solutions
Algebra 1, Homework Practice Workbook (MERRILL ALGEBRA 1)
Additional Math Textbook Solutions
A First Course in Probability (10th Edition)
Thinking Mathematically (6th Edition)
Introductory Statistics
Elementary Statistics: Picturing the World (7th Edition)
Basic Business Statistics, Student Value Edition
- 2) If Mand N be two water hyper Plane ofx Show that MUN and MN is hy Per Plane ofx with prove and Examplame. or 3) IS AUB is convex set and affine set or blensed set or symmetre setorsubsie.... Show that A and B is convex or affine or Hensedsed or symmetivce or subspace. 4) 18 MUN is independence show that Prove or ExPlane Mand Nave independend. or not. 5) Jet X be Vector Pace over I show that is xty tnx st Xty 3 fix→ F s-t f(x) (9) Jet Mand N be two blanced set of Xbe Vector space show tha MUNIS ansed setarrow_forwardFind a polynomial with integer coefficients that satisfies the given conditions. T(x) has degree 4, zeros i and 1 + i, and constant term 12.arrow_forwardHow to solve 2542000/64132 without a calculator?arrow_forward
- How much is the circumference of a circle whose diameter is 7 feet?C =π darrow_forwardHow to solve 2542/64.132arrow_forwardAssume that you fancy polynomial splines, while you actually need ƒ(t) = e²/3 – 1 for t€ [−1, 1]. See the figure for a plot of f(t). Your goal is to approximate f(t) with an inter- polating polynomial spline of degree d that is given as sa(t) = • Σk=0 Pd,k bd,k(t) so that sd(tk) = = Pd,k for tk = −1 + 2 (given d > 0) with basis functions bd,k(t) = Σi±0 Cd,k,i = • The special case of d 0 is trivial: the only basis function b0,0 (t) is constant 1 and so(t) is thus constant po,0 for all t = [−1, 1]. ...9 The d+1 basis functions bd,k (t) form a ba- sis Bd {ba,o(t), ba,1(t), bd,d(t)} of the function space of all possible sα (t) functions. Clearly, you wish to find out, which of them given a particular maximal degree d is the best-possible approximation of f(t) in the least- squares sense. _ 1 0.9 0.8 0.7 0.6 0.5 0.4 0.3 0.2 0.1 0 -0.1 -0.2 -0.3 -0.4 -0.5 -0.6 -0.7 -0.8 -0.9 -1 function f(t) = exp((2t)/3) - 1 to project -1 -0.9 -0.8 -0.7 -0.6 -0.5 -0.4 -0.3 -0.2 -0.1 0 0.1 0.2 0.3 0.4 0.5…arrow_forward
- An image processor considered a 750×750 pixels large subset of an image and converted it into gray-scale, resulting in matrix gIn - a false-color visualization of gIn is shown in the top-left below. He prepared a two-dim. box filter f1 as a 25×25 matrix with only the 5×5 values in the middle being non-zero – this filter is shown in the top-middle position below. He then convolved £1 with itself to get £2, before convolving £2 with itself to get f3. In both of the steps, he maintained the 25×25 size. Next, he convolved gIn with £3 to get gl. Which of the six panels below shows g1? Argue by explaining all the steps, so far: What did the image processor do when preparing ₤3? What image processing operation (from gin to g1) did he prepare and what's the effect that can be seen? Next, he convolved the rows of f3 with filter 1/2 (-1, 8, 0, -8, 1) to get f4 - you find a visualization of filter f 4 below. He then convolved gIn with f4 to get g2 and you can find the result shown below. What…arrow_forward3ur Colors are enchanting and elusive. A multitude of color systems has been proposed over a three-digits number of years - maybe more than the number of purposes that they serve... - Everyone knows the additive RGB color system – we usually serve light-emitting IT components like monitors with colors in that system. Here, we use c = (r, g, b) RGB with r, g, bЄ [0,1] to describe a color c. = T For printing, however, we usually use the subtractive CMY color system. The same color c becomes c = (c, m, y) CMY (1-c, 1-m, 1-y) RGB Note how we use subscripts to indicate with coordinate system the coordinates correspond to. Explain, why it is not possible to find a linear transformation between RGB and CMY coordinates. Farbenlehr c von Goethe Erster Band. Roſt einen Defte mit fergen up Tübingen, is et 3. Cotta'fden Babarblung. ISIO Homogeneous coordinates give us a work-around: If we specify colors in 4D, instead, with the 4th coordinate being the homogeneous coordinate h so that every actual…arrow_forwardCan someone provide an answer & detailed explanation please? Thank you kindly!arrow_forward
- Given the cubic function f(x) = x^3-6x^2 + 11x- 6, do the following: Plot the graph of the function. Find the critical points and determine whether each is a local minimum, local maximum, or a saddle point. Find the inflection point(s) (if any).Identify the intervals where the function is increasing and decreasing. Determine the end behavior of the graph.arrow_forwardGiven the quadratic function f(x) = x^2-4x+3, plot the graph of the function and find the following: The vertex of the parabola .The x-intercepts (if any). The y-intercept. Create graph also before solve.arrow_forwardwhat model best fits this dataarrow_forward
 Algebra and Trigonometry (6th Edition)AlgebraISBN:9780134463216Author:Robert F. BlitzerPublisher:PEARSON
 Contemporary Abstract AlgebraAlgebraISBN:9781305657960Author:Joseph GallianPublisher:Cengage Learning
 Linear Algebra: A Modern IntroductionAlgebraISBN:9781285463247Author:David PoolePublisher:Cengage Learning
 Algebra And Trigonometry (11th Edition)AlgebraISBN:9780135163078Author:Michael SullivanPublisher:PEARSON
 Introduction to Linear Algebra, Fifth EditionAlgebraISBN:9780980232776Author:Gilbert StrangPublisher:Wellesley-Cambridge Press
 College Algebra (Collegiate Math)AlgebraISBN:9780077836344Author:Julie Miller, Donna GerkenPublisher:McGraw-Hill Education


