Concept explainers
Videos
a.
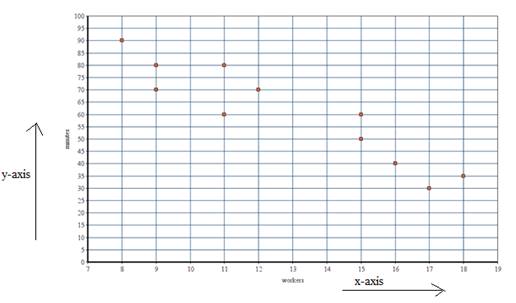
To graph the given data.
a.
Explanation of Solution
Given information:
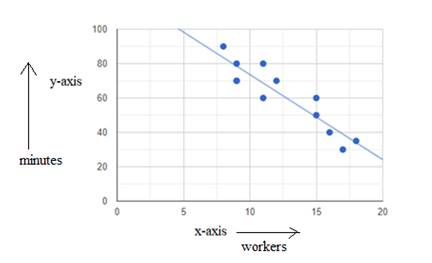
The works and number of minutes they will take to finish job is,
| Workers | Minutes |
| 9 | 80 |
| 16 | 40 |
| 18 | 35 |
| 8 | 90 |
| 15 | 60 |
| 11 | 60 |
| 9 | 70 |
| 17 | 30 |
| 9 | 70 |
| 15 | 50 |
| 11 | 80 |
| 12 | 70 |
Graph:
b.
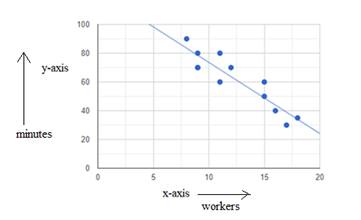
To draw a line to fit to show the trend
b.
Explanation of Solution
Given information:
The works and number of minutes they will take to finish job is,
| Workers | Minutes |
| 9 | 80 |
| 16 | 40 |
| 18 | 35 |
| 8 | 90 |
| 15 | 60 |
| 11 | 60 |
| 9 | 70 |
| 17 | 30 |
| 9 | 70 |
| 15 | 50 |
| 11 | 80 |
| 12 | 70 |
c.
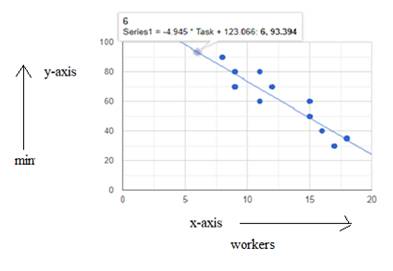
To write the equation of line.
c.
Answer to Problem 4.4.2P
The equation of line is
Explanation of Solution
Given information:
The graph is,

Formula used:
Equation of line in slope intercept form,
Equation of line in
1
Slope is,
3
Calculation:
Let the two points be,
(9, 8) and (15, 50).
Substituting the values in the formula of slope,
So,
On solving,
Hence, slope is 7.
Substituting the values in the equation of line in slope point form,
Converting it into slope intercept form,
Opening the brackets,
Shifting left hand side value to right hand side,
On solving,
Hence, the equation of line in slope-intercept form is,
Conclusion:
The equation of line is
d.
To calculate how long the workers will take to complete the task.
d.
Answer to Problem 4.4.2P
A group of 6 workers will finish the work in 95mins.
Explanation of Solution
Given information:
Number of workers are 6.
Graph for the given data is,
Formula used:
Graph evaluating.
Calculation:
Checking the value of “y” in the graph when “x” is 6
Concluding from the graph,
When
Hence, a group of 6 workers will finish the work in 95mins.
Conclusion:
A group of 6 workers will finish the work in 95mins.
e.
To number of workers needed
e.
Answer to Problem 4.4.2P
14 workers are required to complete work in 45 mins.
Explanation of Solution
Given information:
The time in which the work should be finished is 45mins
The equation of line is
The graph is,
Formula used:
Substitution and equation solving.
Calculation:
Substituting the value in the equation,
Shifting right hand side values to left hand side,
On solving,
Cross- multiplying both sides,
On solving,
Rounding off,
Hence, 14 workers are required to complete work in 45 mins.
Conclusion:
14 workers are required to complete work in 45 mins.
f.
To calculate the y-intercept
f.
Answer to Problem 4.4.2P
The y- intercept is -55.
Explanation of Solution
Given information:
The equation for the given data set is
Formula used:
Equation of line is,
Where, m is slope
c is y-intercept
Calculation:
Comparing with the equation of line and the equation of the given data set,
The y- intercept is,
The y-intercept in this situation tells the total time it will take for 0 workers to do the work.
From the equation the value of y- intercept is negative, which should have been positive, because the time cannot be negative.
Conclusion:
The y- intercept is -55.
Chapter ISG Solutions
Algebra 1, Homework Practice Workbook (MERRILL ALGEBRA 1)
Additional Math Textbook Solutions
University Calculus: Early Transcendentals (4th Edition)
A Problem Solving Approach To Mathematics For Elementary School Teachers (13th Edition)
Intro Stats, Books a la Carte Edition (5th Edition)
Pre-Algebra Student Edition
Basic Business Statistics, Student Value Edition
Elementary Statistics: Picturing the World (7th Edition)


- The Course Name Real Analysis please Solve questions by Real Analysisarrow_forwardpart 3 of the question is: A power outage occurs 6 min after the ride started. Passengers must wait for their cage to be manually cranked into the lowest position in order to exit the ride. Sine function model: where h is the height of the last passenger above the ground measured in feet and t is the time of operation of the ride in minutes. What is the height of the last passenger at the moment of the power outage? Verify your answer by evaluating the sine function model. Will the last passenger to board the ride need to wait in order to exit the ride? Explain.arrow_forward2. The duration of the ride is 15 min. (a) How many times does the last passenger who boarded the ride make a complete loop on the Ferris wheel? (b) What is the position of that passenger when the ride ends?arrow_forward
- 3. A scientist recorded the movement of a pendulum for 10 s. The scientist began recording when the pendulum was at its resting position. The pendulum then moved right (positive displacement) and left (negative displacement) several times. The pendulum took 4 s to swing to the right and the left and then return to its resting position. The pendulum's furthest distance to either side was 6 in. Graph the function that represents the pendulum's displacement as a function of time. Answer: f(t) (a) Write an equation to represent the displacement of the pendulum as a function of time. (b) Graph the function. 10 9 8 7 6 5 4 3 2 1 0 t 1 2 3 4 5 6 7 8 9 10 11 12 13 14 15 -1 -5. -6 -7 -8 -9 -10-arrow_forwardA power outage occurs 6 min after the ride started. Passengers must wait for their cage to be manually cranked into the lowest position in order to exit the ride. Sine function model: h = −82.5 cos (3πt) + 97.5 where h is the height of the last passenger above the ground measured in feet and t is the time of operation of the ride in minutes. (a) What is the height of the last passenger at the moment of the power outage? Verify your answer by evaluating the sine function model. (b) Will the last passenger to board the ride need to wait in order to exit the ride? Explain.arrow_forwardThe Colossus Ferris wheel debuted at the 1984 New Orleans World's Fair. The ride is 180 ft tall, and passengers board the ride at an initial height of 15 ft above the ground. The height above ground, h, of a passenger on the ride is a periodic function of time, t. The graph displays the height above ground of the last passenger to board over the course of the 15 min ride. Height of Passenger in Ferris Wheel 180 160 140- €120 Height, h (ft) 100 80 60 40 20 0 ך 1 2 3 4 5 6 7 8 9 10 11 12 13 14 15 Time of operation, t (min) Sine function model: h = −82.5 cos (3πt) + 97.5 where h is the height of the passenger above the ground measured in feet and t is the time of operation of the ride in minutes. What is the period of the sine function model? Interpret the period you found in the context of the operation of the Ferris wheel. Answer:arrow_forward
- 1. Graph the function f(x)=sin(x) −2¸ Answer: y -2π 一元 1 −1 -2 -3 -4+ 元 2πarrow_forward3. Graph the function f(x) = −(x-2)²+4 Answer: f(x) 6 5 4 3 2+ 1 -6-5 -4-3-2-1 × 1 2 3 4 5 6 -1 -2+ ရာ -3+ -4+ -5 -6arrow_forward2. Graph the function f(x) = cos(2x)+1 Answer: -2π 一元 y 3 2- 1 -1 -2+ ရာ -3- Π 2πarrow_forward
- 2. Graph the function f(x) = |x+1+2 Answer: -6-5-4-3-2-1 f(x) 6 5 4 3 2 1 1 2 3 4 5 6 -1 -2 -3 -4 -5 -6arrow_forward1. The table shows values of a function f(x). What is the average rate of change of f(x) over the interval from x = 5 to x = 9? Show your work. X 4 f(x) LO 5 6 7 8 9 10 -2 8 10 11 14 18arrow_forward• Find a real-world situation that can be represented by a sinusoidal function. You may find something online that represents a sinusoidal graph or you can create a sinusoidal graph yourself with a measuring tape and a rope. • Provide a graph complete with labels and units for the x- and y-axes. • Describe the amplitude, period, and vertical shift in terms of the real-world situation.arrow_forward
 Algebra and Trigonometry (6th Edition)AlgebraISBN:9780134463216Author:Robert F. BlitzerPublisher:PEARSON
 Contemporary Abstract AlgebraAlgebraISBN:9781305657960Author:Joseph GallianPublisher:Cengage Learning
 Linear Algebra: A Modern IntroductionAlgebraISBN:9781285463247Author:David PoolePublisher:Cengage Learning
 Algebra And Trigonometry (11th Edition)AlgebraISBN:9780135163078Author:Michael SullivanPublisher:PEARSON
 Introduction to Linear Algebra, Fifth EditionAlgebraISBN:9780980232776Author:Gilbert StrangPublisher:Wellesley-Cambridge Press
 College Algebra (Collegiate Math)AlgebraISBN:9780077836344Author:Julie Miller, Donna GerkenPublisher:McGraw-Hill Education