Concept explainers
Videos
a.
To find: If the two packages of pasta likely have the same advertised weight and to find out the manufacturer whose quality control appears better.
a.
Answer to Problem 10.4.1P
It is very much likely that both packages of pasta have the same advertised weight, Rafaello Pasta’s quantity control appears better.
Explanation of Solution
Given Information: Two relevant histograms.
Analyzing the two histograms,
In histogram of Cucina Leonardo, the data is widely dispersed but the data is concentrated around
Rafaello Pasta’s quantity control appears better because data lies around
Thus, it is very much likely that both packages of pasta have the same advertised weight, Rafaello Pasta’s quantity control appears better.
b.
To infer: The two population distribution shapes by sketching smooth curves across the tops of the histograms and describe the shapes.
b.
Answer to Problem 10.4.1P
Result is bell shaped formation, this implies that distribution is symmetric.
Explanation of Solution
Given Information: Two relevant histograms.
Sketch:
Sketching smooth curves across the tops of histograms,
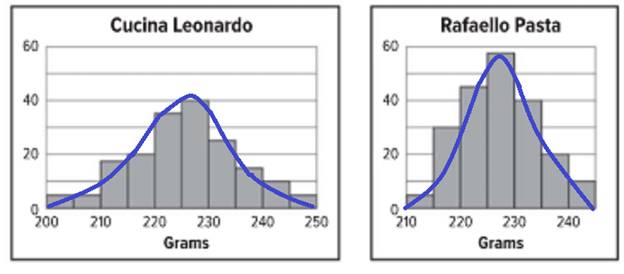
Both result in bell shaped formation, this implies that distribution is symmetric and most of the data is clustered around a center and as one moves away from center frequency keeps on decreasing. In this case, center is the advertised weight and other data values are a result of negligence during preparation and filling pasta in packages.
Thus, result is bell shaped formation, this implies that distribution is symmetric.
Chapter ISG Solutions
Algebra 1, Homework Practice Workbook (MERRILL ALGEBRA 1)
Additional Math Textbook Solutions
Calculus: Early Transcendentals (2nd Edition)
Elementary Statistics: Picturing the World (7th Edition)
A First Course in Probability (10th Edition)
Basic Business Statistics, Student Value Edition
University Calculus: Early Transcendentals (4th Edition)
Elementary Statistics (13th Edition)


- Safari File Edit View History Bookmarks Window Help Ο Ω OV O mA 0 mW ర Fri Apr 4 1 222 tv A F9 F10 DII 4 F6 F7 F8 7 29 8 00 W E R T Y U S D பட 9 O G H J K E F11 + 11 F12 O P } [arrow_forwardSo confused. Step by step instructions pleasearrow_forwardIn simplest terms, Sketch the graph of the parabola. Then, determine its equation. opens downward, vertex is (- 4, 7), passes through point (0, - 39)arrow_forward
- In simplest way, For each quadratic relation, find the zeros and the maximum or minimum. a) y = x 2 + 16 x + 39 b) y = 5 x2 - 50 x - 120arrow_forwardIn simplest terms and step by step Write each quadratic relation in standard form, then fi nd the zeros. y = - 4( x + 6)2 + 36arrow_forwardIn simplest terms and step by step For each quadratic relation, find the zeros and the maximum or minimum. 1) y = - 2 x2 - 28 x + 64 2) y = 6 x2 + 36 x - 42arrow_forward
- Write each relation in standard form a)y = 5(x + 10)2 + 7 b)y = 9(x - 8)2 - 4arrow_forwardIn simplest form and step by step Write the quadratic relation in standard form, then fi nd the zeros. y = 3(x - 1)2 - 147arrow_forwardStep by step instructions The path of a soccer ball can be modelled by the relation h = - 0.1 d 2 + 0.5 d + 0.6, where h is the ball’s height and d is the horizontal distance from the kicker. a) Find the zeros of the relation.arrow_forward
 Algebra and Trigonometry (6th Edition)AlgebraISBN:9780134463216Author:Robert F. BlitzerPublisher:PEARSON
 Contemporary Abstract AlgebraAlgebraISBN:9781305657960Author:Joseph GallianPublisher:Cengage Learning
 Linear Algebra: A Modern IntroductionAlgebraISBN:9781285463247Author:David PoolePublisher:Cengage Learning
 Algebra And Trigonometry (11th Edition)AlgebraISBN:9780135163078Author:Michael SullivanPublisher:PEARSON
 Introduction to Linear Algebra, Fifth EditionAlgebraISBN:9780980232776Author:Gilbert StrangPublisher:Wellesley-Cambridge Press
 College Algebra (Collegiate Math)AlgebraISBN:9780077836344Author:Julie Miller, Donna GerkenPublisher:McGraw-Hill Education