Videos
a.
To write: an exponential function which fits this data and can be used to predict the deer population in future years.
a.
Answer to Problem 7.5.5P
Equation of the exponential function is
Explanation of Solution
Given information: The table shows the estimated number of deer in the forest over a 3-.
year period .
| Years of Study | 0 | 1 | 2 | 3 |
| Population | 128 | 160 | 200 | 250 |
Formula used:
The general equation of an exponential function is,
Calculation:
From the table data a =128 and the function passes through point (1,160), so:
So, equation of the exponential function will be:
b.
To calculate: the average rate of change in population during those three years.
b.
Answer to Problem 7.5.5P
The average rate of change in population during those three years is 40.67.
Explanation of Solution
Given information: The table shows the estimated number of deer in the forest over a 3-.
year period .
| Years of Study | 0 | 1 | 2 | 3 |
| Population | 128 | 160 | 200 | 250 |
Calculation:
From the table the rate of change in population in first year = (160-128) =32.
The rate of change in population in second year = (200-160) =40.
The rate of change in population in third year = (250-200) =50.
So, the average rate of change in population during those three years:
c.
To make: a conjecture.
c.
Answer to Problem 7.5.5P
The deer population continues increase by the average rate of change 40.67 as year increases.
Explanation of Solution
Given information: If the population growth follows the model from part a, the deer
population to continue to increase by the value with in part b.
Calculation:
Since
d.
To find: how know the function is exponential, not linear.
d.
Answer to Problem 7.5.5P
Exponential function.
Explanation of Solution
Given information: If the population growth follows the model from part a, the deer
population to continue to increase by the value with in part b
Calculation:
Given function is exponential because population change from one year to next year increases exponentially not constant.
e.
To graph: deer population increase function and their food supply function.
e.
Answer to Problem 7.5.5P
Red curve show the graph of
Blue curve shows the graph of
Explanation of Solution
Given information: Given functions are
Calculation:
The graph of the functions
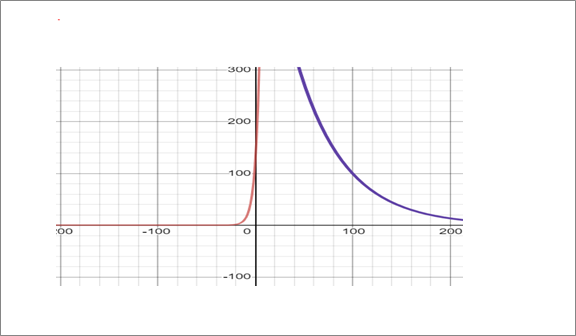
Red curve show the graph of
Blue curve shows the graph of
Chapter ISG Solutions
Algebra 1, Homework Practice Workbook (MERRILL ALGEBRA 1)
Additional Math Textbook Solutions
Using and Understanding Mathematics: A Quantitative Reasoning Approach (6th Edition)
Pre-Algebra Student Edition
A Problem Solving Approach To Mathematics For Elementary School Teachers (13th Edition)
University Calculus: Early Transcendentals (4th Edition)
Calculus: Early Transcendentals (2nd Edition)


- Safari File Edit View History Bookmarks Window Help Ο Ω OV O mA 0 mW ర Fri Apr 4 1 222 tv A F9 F10 DII 4 F6 F7 F8 7 29 8 00 W E R T Y U S D பட 9 O G H J K E F11 + 11 F12 O P } [arrow_forwardSo confused. Step by step instructions pleasearrow_forwardIn simplest terms, Sketch the graph of the parabola. Then, determine its equation. opens downward, vertex is (- 4, 7), passes through point (0, - 39)arrow_forward
- In simplest way, For each quadratic relation, find the zeros and the maximum or minimum. a) y = x 2 + 16 x + 39 b) y = 5 x2 - 50 x - 120arrow_forwardIn simplest terms and step by step Write each quadratic relation in standard form, then fi nd the zeros. y = - 4( x + 6)2 + 36arrow_forwardIn simplest terms and step by step For each quadratic relation, find the zeros and the maximum or minimum. 1) y = - 2 x2 - 28 x + 64 2) y = 6 x2 + 36 x - 42arrow_forward
- Write each relation in standard form a)y = 5(x + 10)2 + 7 b)y = 9(x - 8)2 - 4arrow_forwardIn simplest form and step by step Write the quadratic relation in standard form, then fi nd the zeros. y = 3(x - 1)2 - 147arrow_forwardStep by step instructions The path of a soccer ball can be modelled by the relation h = - 0.1 d 2 + 0.5 d + 0.6, where h is the ball’s height and d is the horizontal distance from the kicker. a) Find the zeros of the relation.arrow_forward
 Algebra and Trigonometry (6th Edition)AlgebraISBN:9780134463216Author:Robert F. BlitzerPublisher:PEARSON
 Contemporary Abstract AlgebraAlgebraISBN:9781305657960Author:Joseph GallianPublisher:Cengage Learning
 Linear Algebra: A Modern IntroductionAlgebraISBN:9781285463247Author:David PoolePublisher:Cengage Learning
 Algebra And Trigonometry (11th Edition)AlgebraISBN:9780135163078Author:Michael SullivanPublisher:PEARSON
 Introduction to Linear Algebra, Fifth EditionAlgebraISBN:9780980232776Author:Gilbert StrangPublisher:Wellesley-Cambridge Press
 College Algebra (Collegiate Math)AlgebraISBN:9780077836344Author:Julie Miller, Donna GerkenPublisher:McGraw-Hill Education