Concept explainers
Videos
Measuring Area from a Boundary: The Planimeter

Figure 6.47 This magnetic resonance image of a patient’s brain shows a tumor, which is highlighted in red. (credit: modification of wood’ by Christaras A Wikimedia Commons)
Imagine you are a doctor who has just received a magnetic resonance image of your patent’s brain. The brain has a tumor (Figure 6.47). How large is the tumor? To be precise, what is the area of the red region? The red cross-section of the tumor has an irregular shape, and therefore it is unlikely that you would be able o find a set of equations or inequalities for the region and then be able to calculate its area by conventional means. You could approximate the area by chopping the region into tiny squares (a Riemann sum approach), but this method always gives an answer with some error.
Instead of trying to measure the area of the region directly, we can use a device called a rolling planimeter to calculate the area of the region exactly, simply by measuring its boundary. In this project you investigate how a planimeter works, and you use Green’s theorem to show the device calculates area correctly.
A rolling planimeter is a device that measures the area of a planar region by tracing out the boundary of that region (Figure 6.48). To measure the area of a region, we simply run the tracer of the planimeter around the boundary of the region. The planimeter measures the number of turns through which the wheel rotates as we (race the boundary; the area of the shape is proportional to this number of wheel ruins. We can derive the precise proportionality equation using Green’s theorem. As the (racer moves around the boundary of the region, the tracer arm rotates and the roller moves back and forth (but does no; rotate).
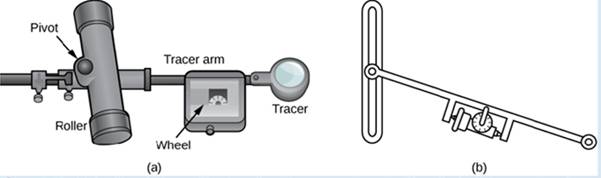
Figure 6.48 (a) A rolling planimeter. The pivot allows the tracer arm to rotate. The roller itself does not rotate; it only moves back and forth. (b) An interior view of a rolling planimeter. Notice that the wheel cannot rum if the planimeter is moving back and forth th the tracer arm perpendicular to the roller.
Let C denote the boundary of region D. the area to be calculated. As the tracer traverses curve C, assume the roller moves along the y-axis (since the roller does not rotate, one can assume it moves along a straight line). Use the coordinates (x, y) to represent points on boundary C, and coordinates (0, y) to represent the position of the pivot. As the planimeter traces C. the pivot moves along the y-axis while the tracer arm rotates on the pivot.  Watch a short animation (http://www.openstaxcollege.org/I/20_pianimeter) of a planimeter in action. Begin the analysis by considering the motion of the tracer as it moves from point (x, y) counterclockwise to point (x + dx. y + dy) that is close to (x, y) (Figure 6.49). The pivot also moves, from point (0, y) to nearby point (0, y + dy). How much does the wheel turn as a result of this motion? To answer this question, break the motion into two parts. First, roll the pivot along they-axis from (0. y) to (0, y + dy) without rotating the tracer arm. The tracer arm then ends up a point (x, y + dy) while maintaining a constant angle with the x-axis. Second, rotate the tracer arm by an angle d
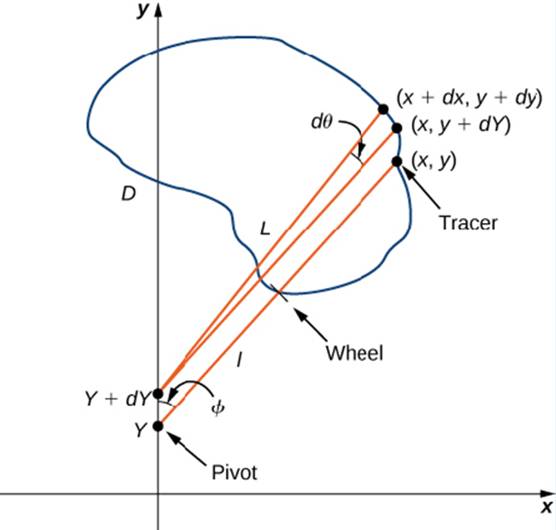
Figure 6.49 Mathematical analysis of the motion of the planimeter.
9. Use Green’s theorem to that the area of D is
Want to see the full answer?
Check out a sample textbook solution
Chapter 6 Solutions
Calculus Volume 3
Additional Math Textbook Solutions
Precalculus
Elementary Statistics: Picturing the World (7th Edition)
Elementary Statistics (13th Edition)
A First Course in Probability (10th Edition)
A Problem Solving Approach To Mathematics For Elementary School Teachers (13th Edition)
University Calculus: Early Transcendentals (4th Edition)


- Theorem 1: A number n ∈ N is divisible by 3 if and only if when n is writtenin base 10 the sum of its digits is divisible by 3. As an example, 132 is divisible by 3 and 1 + 3 + 2 is divisible by 3.1. Prove Theorem 1 2. Using Theorem 1 construct an NFA over the alphabet Σ = {0, 1, 2, 3, 4, 5, 6, 7, 8, 9}which recognizes the language {w ∈ Σ^(∗)| w = 3k, k ∈ N}.arrow_forwardRecall the RSA encryption/decryption system. The following questions are based on RSA. Suppose n (=15) is the product of the two prime numbers 3 and 5.1. Find an encryption key e for for the pair (e, n)2. Find a decryption key d for for the pair (d, n)3. Given the plaintext message x = 3, find the ciphertext y = x^(e) (where x^e is the message x encoded with encryption key e)4. Given the ciphertext message y (which you found in previous part), Show that the original message x = 3 can be recovered using (d, n)arrow_forwardFind the sum of products expansion of the function F(x, y, z) = ¯x · y + x · z in two ways: (i) using a table; and (ii) using Boolean identities.arrow_forward
- Give both a machine-level description (i.e., step-by-step description in words) and a state-diagram for a Turing machine that accepts all words over the alphabet {a, b} where the number of a’s is greater than or equal to the number of b’s.arrow_forwardCompute (7^ (25)) mod 11 via the algorithm for modular exponentiation.arrow_forwardProve that the sum of the degrees in the interior angles of any convex polygon with n ≥ 3 sides is (n − 2) · 180. For the base case, you must prove that a triangle has angles summing to 180 degrees. You are permitted to use thefact when two parallel lines are cut by a transversal that corresponding angles are equal.arrow_forward
- Answer the following questions about rational and irrational numbers.1. Prove or disprove: If a and b are rational numbers then a^b is rational.2. Prove or disprove: If a and b are irrational numbers then a^b is irrational.arrow_forwardProve the following using structural induction: For any rooted binary tree T the number of vertices |T| in T satisfies the inequality |T| ≤ (2^ (height(T)+1)) − 1.arrow_forward(a) Prove that if p is a prime number and p|k^2 for some integer k then p|k.(b) Using Part (a), prove or disprove: √3 ∈ Q.arrow_forward
- Provide a context-free grammar for the language {a^ (i) b^ (j) c^ (k) | i, j, k ∈ N, i = j or i = k}. Briefly explain (no formal proof needed) why your context-free grammar is correct and show that it produces the word aaabbccc.arrow_forwardThe Martinezes are planning to refinance their home. The outstanding balance on their original loan is $150,000. Their finance company has offered them two options. (Assume there are no additional finance charges. Round your answers to the nearest cent.) Option A: A fixed-rate mortgage at an interest rate of 4.5%/year compounded monthly, payable over a 30-year period in 360 equal monthly installments.Option B: A fixed-rate mortgage at an interest rate of 4.25%/year compounded monthly, payable over a 12-year period in 144 equal monthly installments. (a) Find the monthly payment required to amortize each of these loans over the life of the loan. option A $ option B $ (b) How much interest would the Martinezes save if they chose the 12-year mortgage instead of the 30-year mortgage?arrow_forwardThe Martinezes are planning to refinance their home. The outstanding balance on their original loan is $150,000. Their finance company has offered them two options. (Assume there are no additional finance charges. Round your answers to the nearest cent.) Option A: A fixed-rate mortgage at an interest rate of 4.5%/year compounded monthly, payable over a 30-year period in 360 equal monthly installments.Option B: A fixed-rate mortgage at an interest rate of 4.25%/year compounded monthly, payable over a 12-year period in 144 equal monthly installments. (a) Find the monthly payment required to amortize each of these loans over the life of the loan. option A $ option B $ (b) How much interest would the Martinezes save if they chose the 12-year mortgage instead of the 30-year mortgage?arrow_forward
 Algebra & Trigonometry with Analytic GeometryAlgebraISBN:9781133382119Author:SwokowskiPublisher:Cengage
 Holt Mcdougal Larson Pre-algebra: Student Edition...AlgebraISBN:9780547587776Author:HOLT MCDOUGALPublisher:HOLT MCDOUGAL
 Mathematics For Machine TechnologyAdvanced MathISBN:9781337798310Author:Peterson, John.Publisher:Cengage Learning,
 Trigonometry (MindTap Course List)TrigonometryISBN:9781305652224Author:Charles P. McKeague, Mark D. TurnerPublisher:Cengage Learning