Concept explainers
Videos
Measuring Area from a Boundary: The Planimeter
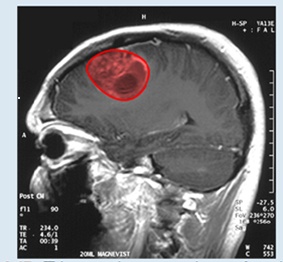
Figure 6.47 This magnetic resonance image of a patient’s brain shows a tumor, which is highlighted in red. (credit: modification of wood’ by Christaras A Wikimedia Commons)
Imagine you are a doctor who has just received a magnetic resonance image of your patent’s brain. The brain has a tumor (Figure 6.47). How large is the tumor? To be precise, what is the area of the red region? The red cross-section of the tumor has an irregular shape, and therefore it is unlikely that you would be able o find a set of equations or inequalities for the region and then be able to calculate its area by conventional means. You could approximate the area by chopping the region into tiny squares (a Riemann sum approach), but this method always gives an answer with some error.
Instead of trying to measure the area of the region directly, we can use a device called a rolling planimeter to calculate the area of the region exactly, simply by measuring its boundary. In this project you investigate how a planimeter works, and you use Green’s theorem to show the device calculates area correctly.
A rolling planimeter is a device that measures the area of a planar region by tracing out the boundary of that region (Figure 6.48). To measure the area of a region, we simply run the tracer of the planimeter around the boundary of the region. The planimeter measures the number of turns through which the wheel rotates as we (race the boundary; the area of the shape is proportional to this number of wheel ruins. We can derive the precise proportionality equation using Green’s theorem. As the (racer moves around the boundary of the region, the tracer arm rotates and the roller moves back and forth (but does no; rotate).
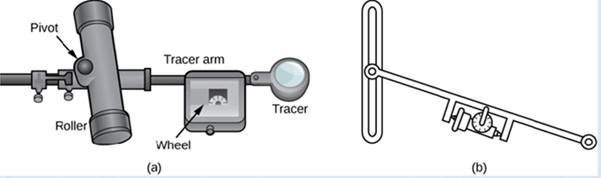
Figure 6.48 (a) A rolling planimeter. The pivot allows the tracer arm to rotate. The roller itself does not rotate; it only moves back and forth. (b) An interior view of a rolling planimeter. Notice that the wheel cannot rum if the planimeter is moving back and forth th the tracer arm perpendicular to the roller.
Let C denote the boundary of region D. the area to be calculated. As the tracer traverses curve C, assume the roller moves along the y-axis (since the roller does not rotate, one can assume it moves along a straight line). Use the coordinates (x, y) to represent points on boundary C, and coordinates (0, y) to represent the position of the pivot. As the planimeter traces C. the pivot moves along the y-axis while the tracer arm rotates on the pivot.  Watch a short animation (http://www.openstaxcollege.org/I/20_pianimeter) of a planimeter in action. Begin the analysis by considering the motion of the tracer as it moves from point (x, y) counterclockwise to point (x + dx. y + dy) that is close to (x, y) (Figure 6.49). The pivot also moves, from point (0, y) to nearby point (0, y + dy). How much does the wheel turn as a result of this motion? To answer this question, break the motion into two parts. First, roll the pivot along they-axis from (0. y) to (0, y + dy) without rotating the tracer arm. The tracer arm then ends up a point (x, y + dy) while maintaining a constant angle with the x-axis. Second, rotate the tracer arm by an angle d
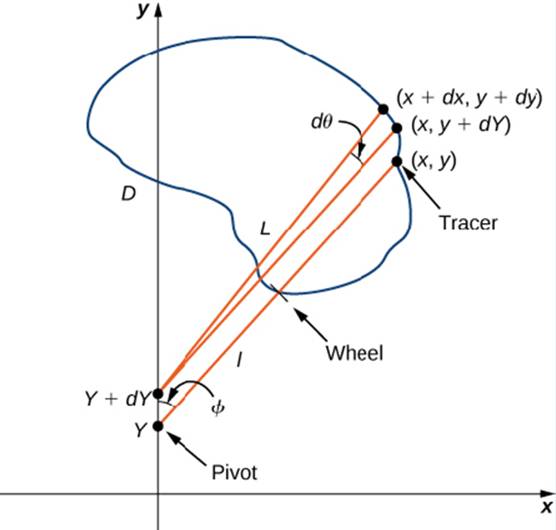
Figure 6.49 Mathematical analysis of the motion of the planimeter. 1. Explain why the total distance through which the wheel rolls the small motion just
described is
Want to see the full answer?
Check out a sample textbook solution
Chapter 6 Solutions
Calculus Volume 3
Additional Math Textbook Solutions
A Problem Solving Approach To Mathematics For Elementary School Teachers (13th Edition)
Calculus: Early Transcendentals (2nd Edition)
Elementary Statistics (13th Edition)
A First Course in Probability (10th Edition)
University Calculus: Early Transcendentals (4th Edition)


- I need help explaining on this example on how can I define the Time-Domain Function, Apply the Laplace Transformation Formula, andarrow_forwardma Classes Term. Spring 2025 Title Details Credit Hours CRN Schedule Type Grade Mode Level Date Status Message *MATHEMATICS FOR MANAGEME... MTH 245, 400 4 54835 Online Normal Grading Mode Ecampus Undergradu... 03/21/2025 Registered **Web Registered... *SOIL SCIENCE CSS 205, 400 0 52298 Online Normal Grading Mode Undergraduate 03/21/2025 Waitlisted Waitlist03/21/2025 PLANT PATHOLOGY BOT 451, 400 4 56960 Online Normal Grading Mode Undergraduate 03/21/2025 Registered **Web Registered... Records: 3 Schedule Schedule Detailsarrow_forwardHere is an augmented matrix for a system of equations (three equations and three variables). Let the variables used be x, y, and z: 1 2 4 6 0 1 -1 3 0 0 1 4 Note: that this matrix is already in row echelon form. Your goal is to use this row echelon form to revert back to the equations that this represents, and then to ultimately solve the system of equations by finding x, y and z. Input your answer as a coordinate point: (x,y,z) with no spaces.arrow_forward
- 1 3 -4 In the following matrix perform the operation 2R1 + R2 → R2. -2 -1 6 After you have completed this, what numeric value is in the a22 position?arrow_forward5 -2 0 1 6 12 Let A = 6 7 -1 and B = 1/2 3 -14 -2 0 4 4 4 0 Compute -3A+2B and call the resulting matrix R. If rij represent the individual entries in the matrix R, what numeric value is in 131? Input your answer as a numeric value only.arrow_forward1 -2 4 10 My goal is to put the matrix 5 -1 1 0 into row echelon form using Gaussian elimination. 3 -2 6 9 My next step is to manipulate this matrix using elementary row operations to get a 0 in the a21 position. Which of the following operations would be the appropriate elementary row operation to use to get a 0 in the a21 position? O (1/5)*R2 --> R2 ○ 2R1 + R2 --> R2 ○ 5R1+ R2 --> R2 O-5R1 + R2 --> R2arrow_forward
- The 2x2 linear system of equations -2x+4y = 8 and 4x-3y = 9 was put into the following -2 4 8 augmented matrix: 4 -3 9 This augmented matrix is then converted to row echelon form. Which of the following matrices is the appropriate row echelon form for the given augmented matrix? 0 Option 1: 1 11 -2 Option 2: 4 -3 9 Option 3: 10 ܂ -2 -4 5 25 1 -2 -4 Option 4: 0 1 5 1 -2 Option 5: 0 0 20 -4 5 ○ Option 1 is the appropriate row echelon form. ○ Option 2 is the appropriate row echelon form. ○ Option 3 is the appropriate row echelon form. ○ Option 4 is the appropriate row echelon form. ○ Option 5 is the appropriate row echelon form.arrow_forwardLet matrix A have order (dimension) 2x4 and let matrix B have order (dimension) 4x4. What results when you compute A+B? The resulting matrix will have dimensions of 2x4. ○ The resulting matrix will be a single number (scalar). The resulting matrix will have dimensions of 4x4. A+B is undefined since matrix A and B do not have the same dimensions.arrow_forwardIf -1 "[a446]-[254] 4b = -1 , find the values of a and b. ○ There is no solution for a and b. ○ There are infinite solutions for a and b. O a=3, b=3 O a=1, b=2 O a=2, b=1 O a=2, b=2arrow_forward
- A student puts a 3x3 system of linear equations is into an augmented matrix. The student then correctly puts the augmented matrix into row echelon form (REF), which yields the following resultant matrix: -2 3 -0.5 10 0 0 0 -2 0 1 -4 Which of the following conclusions is mathematically supported by the work shown about system of linear equations? The 3x3 system of linear equations has no solution. ○ The 3x3 system of linear equations has infinite solutions. The 3x3 system of linear equations has one unique solution.arrow_forwardSolve the following system of equations using matrices: -2x + 4y = 8 and 4x - 3y = 9 Note: This is the same system of equations referenced in Question 14. If a single solution exists, express your solution as an (x,y) coordinate point with no spaces. If there are infinite solutions write inf and if there are no solutions write ns in the box.arrow_forwardHi, I need to make sure I have drafted a thorough analysis, so please answer the following questions. Based on the data in the attached image, develop a regression model to forecast the average sales of football magazines for each of the seven home games in the upcoming season (Year 10). That is, you should construct a single regression model and use it to estimate the average demand for the seven home games in Year 10. In addition to the variables provided, you may create new variables based on these variables or based on observations of your analysis. Be sure to provide a thorough analysis of your final model (residual diagnostics) and provide assessments of its accuracy. What insights are available based on your regression model?arrow_forward
 Algebra & Trigonometry with Analytic GeometryAlgebraISBN:9781133382119Author:SwokowskiPublisher:Cengage
 Holt Mcdougal Larson Pre-algebra: Student Edition...AlgebraISBN:9780547587776Author:HOLT MCDOUGALPublisher:HOLT MCDOUGAL
 Mathematics For Machine TechnologyAdvanced MathISBN:9781337798310Author:Peterson, John.Publisher:Cengage Learning,
 Trigonometry (MindTap Course List)TrigonometryISBN:9781305652224Author:Charles P. McKeague, Mark D. TurnerPublisher:Cengage Learning