Concept explainers
Videos
Measuring Area from a Boundary: The Planimeter
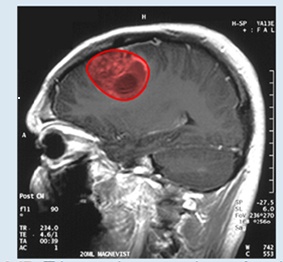
Figure 6.47 This magnetic resonance image of a patient’s brain shows a tumor, which is highlighted in red. (credit: modification of wood’ by Christaras A Wikimedia Commons)
Imagine you are a doctor who has just received a magnetic resonance image of your patent’s brain. The brain has a tumor (Figure 6.47). How large is the tumor? To be precise, what is the area of the red region? The red cross-section of the tumor has an irregular shape, and therefore it is unlikely that you would be able o find a set of equations or inequalities for the region and then be able to calculate its area by conventional means. You could approximate the area by chopping the region into tiny squares (a Riemann sum approach), but this method always gives an answer with some error.
Instead of trying to measure the area of the region directly, we can use a device called a rolling planimeter to calculate the area of the region exactly, simply by measuring its boundary. In this project you investigate how a planimeter works, and you use Green’s theorem to show the device calculates area correctly.
A rolling planimeter is a device that measures the area of a planar region by tracing out the boundary of that region (Figure 6.48). To measure the area of a region, we simply run the tracer of the planimeter around the boundary of the region. The planimeter measures the number of turns through which the wheel rotates as we (race the boundary; the area of the shape is proportional to this number of wheel ruins. We can derive the precise proportionality equation using Green’s theorem. As the (racer moves around the boundary of the region, the tracer arm rotates and the roller moves back and forth (but does no; rotate).
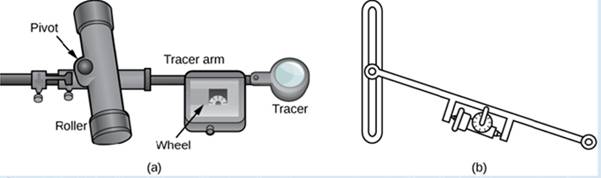
Figure 6.48 (a) A rolling planimeter. The pivot allows the tracer arm to rotate. The roller itself does not rotate; it only moves back and forth. (b) An interior view of a rolling planimeter. Notice that the wheel cannot rum if the planimeter is moving back and forth th the tracer arm perpendicular to the roller.
Let C denote the boundary of region D. the area to be calculated. As the tracer traverses curve C, assume the roller moves along the y-axis (since the roller does not rotate, one can assume it moves along a straight line). Use the coordinates (x, y) to represent points on boundary C, and coordinates (0, y) to represent the position of the pivot. As the planimeter traces C. the pivot moves along the y-axis while the tracer arm rotates on the pivot.  Watch a short animation (http://www.openstaxcollege.org/I/20_pianimeter) of a planimeter in action. Begin the analysis by considering the motion of the tracer as it moves from point (x, y) counterclockwise to point (x + dx. y + dy) that is close to (x, y) (Figure 6.49). The pivot also moves, from point (0, y) to nearby point (0, y + dy). How much does the wheel turn as a result of this motion? To answer this question, break the motion into two parts. First, roll the pivot along they-axis from (0. y) to (0, y + dy) without rotating the tracer arm. The tracer arm then ends up a point (x, y + dy) while maintaining a constant angle with the x-axis. Second, rotate the tracer arm by an angle d
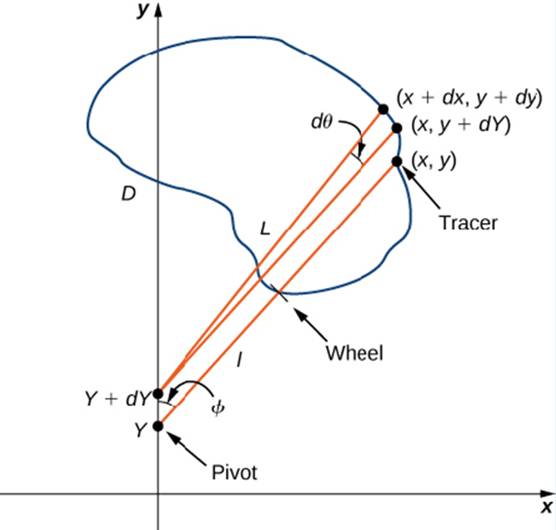
Figure 6.49 Mathematical analysis of the motion of the planimeter.
6. Use step 5 to show that
Want to see the full answer?
Check out a sample textbook solution
Chapter 6 Solutions
Calculus Volume 3
Additional Math Textbook Solutions
A Problem Solving Approach To Mathematics For Elementary School Teachers (13th Edition)
A First Course in Probability (10th Edition)
Elementary Statistics (13th Edition)
Elementary Statistics: Picturing the World (7th Edition)
Thinking Mathematically (6th Edition)
University Calculus: Early Transcendentals (4th Edition)


- 3) Which of the following are equivalent to 3? (There may be more than one that is equivalent!) -1 (a) (9)¯¹ 3. (b) (-3)-1 (c) (-3) -1 (d) -(¯3) (e) 11 3-1 (f) 3-4arrow_forwardY- ___b=_____ (X- )arrow_forwardFor each of the time series, construct a line chart of the data and identify the characteristics of the time series (that is, random, stationary, trend, seasonal, or cyclical) Date IBM9/7/2010 $125.959/8/2010 $126.089/9/2010 $126.369/10/2010 $127.999/13/2010 $129.619/14/2010 $128.859/15/2010 $129.439/16/2010 $129.679/17/2010 $130.199/20/2010 $131.79arrow_forward
- 5) State any theorems that you use in determining your solution. a) Suppose you are given a model with two explanatory variables such that: Yi = a +ẞ1x1 + ẞ2x2i + Ui, i = 1, 2, ... n Using partial differentiation derive expressions for the intercept and slope coefficients for the model above. [25 marks] b) A production function is specified as: Yi = α + B₁x1i + ẞ2x2i + Ui, i = 1, 2, ... n, u₁~N(0,σ²) where: y = log(output), x₁ = log(labor input), x2 = log(capital input) The results are as follows: x₁ = 10, x2 = 5, ỹ = 12, S11 = 12, S12= 8, S22 = 12, S₁y = 10, = 8, Syy = 10, S2y n = 23 (individual firms) i) Compute values for the intercept, the slope coefficients and σ². [20 marks] ii) Show that SE (B₁) = 0.102. [15 marks] iii) Test the hypotheses: ẞ1 = 1 and B2 = 0, separately at the 5% significance level. You may take without calculation that SE (a) = 0.78 and SE (B2) = 0.102 [20 marks] iv) Find a 95% confidence interval for the estimate ẞ2. [20 marks]arrow_forwardPage < 2 of 2 - ZOOM + The set of all 3 x 3 upper triangular matrices 6) Determine whether each of the following sets, together with the standard operations, is a vector space. If it is, then simply write 'Vector space'. You do not have to prove all ten vector space axioms. If it is not, then identify one of the ten vector space axioms with its number in the attached sheet that fails and also show that how it fails. a) The set of all polynomials of degree four or less. b) The set of all 2 x 2 singular matrices. c) The set {(x, y) : x ≥ 0, y is a real number}. d) C[0,1], the set of all continuous functions defined on the interval [0,1]. 7) Given u = (-2,1,1) and v = (4,2,0) are two vectors in R³-space. Find u xv and show that it is orthogonal to both u and v. 8) a) Find the equation of the least squares regression line for the data points below. (-2,0), (0,2), (2,2) b) Graph the points and the line that you found from a) on the same Cartesian coordinate plane.arrow_forward1. A consumer group claims that the mean annual consumption of cheddar cheese by a person in the United States is at most 10.3 pounds. A random sample of 100 people in the United States has a mean annual cheddar cheese consumption of 9.9 pounds. Assume the population standard deviation is 2.1 pounds. At a = 0.05, can you reject the claim? (Adapted from U.S. Department of Agriculture) State the hypotheses: Calculate the test statistic: Calculate the P-value: Conclusion (reject or fail to reject Ho): 2. The CEO of a manufacturing facility claims that the mean workday of the company's assembly line employees is less than 8.5 hours. A random sample of 25 of the company's assembly line employees has a mean workday of 8.2 hours. Assume the population standard deviation is 0.5 hour and the population is normally distributed. At a = 0.01, test the CEO's claim. State the hypotheses: Calculate the test statistic: Calculate the P-value: Conclusion (reject or fail to reject Ho): Statisticsarrow_forward
- Page < 1 of 2 - ZOOM + 1) a) Find a matrix P such that PT AP orthogonally diagonalizes the following matrix A. = [{² 1] A = b) Verify that PT AP gives the correct diagonal form. 2 01 -2 3 2) Given the following matrices A = -1 0 1] an and B = 0 1 -3 2 find the following matrices: a) (AB) b) (BA)T 3) Find the inverse of the following matrix A using Gauss-Jordan elimination or adjoint of the matrix and check the correctness of your answer (Hint: AA¯¹ = I). [1 1 1 A = 3 5 4 L3 6 5 4) Solve the following system of linear equations using any one of Cramer's Rule, Gaussian Elimination, Gauss-Jordan Elimination or Inverse Matrix methods and check the correctness of your answer. 4x-y-z=1 2x + 2y + 3z = 10 5x-2y-2z = -1 5) a) Describe the zero vector and the additive inverse of a vector in the vector space, M3,3. b) Determine if the following set S is a subspace of M3,3 with the standard operations. Show all appropriate supporting work.arrow_forwardFind the Laplace Transform of the function to express it in frequency domain form.arrow_forwardPlease draw a graph that represents the system of equations f(x) = x2 + 2x + 2 and g(x) = –x2 + 2x + 4?arrow_forward
- Given the following system of equations and its graph below, what can be determined about the slopes and y-intercepts of the system of equations? 7 y 6 5 4 3 2 -6-5-4-3-2-1 1+ -2 1 2 3 4 5 6 x + 2y = 8 2x + 4y = 12 The slopes are different, and the y-intercepts are different. The slopes are different, and the y-intercepts are the same. The slopes are the same, and the y-intercepts are different. O The slopes are the same, and the y-intercepts are the same.arrow_forwardChoose the function to match the graph. -2- 0 -7 -8 -9 --10- |--11- -12- f(x) = log x + 5 f(x) = log x - 5 f(x) = log (x+5) f(x) = log (x-5) 9 10 11 12 13 14arrow_forwardQ2 H let x(+) = &cos (Ait+U) and. 4(+) = ß cos(12t +V), where d. B. 1. In Constants and U,V indep.rus have uniform dist. (-π,π) Show that: ①Rxy (+,4+1)=0 @ Rxy (++) = cos [ when U=V Q3 let x(t) is stochastic process with Wss -121 e, and Rx ltst+1) = ( 2, show that E(X) = E(XS-X₁)² = 2(-1). Qu let x(t) = U Cost + (V+1) Sint, tεIR. where UV indep.rus, and let E (U)-E(V)=0 and E(U) = E(V) = 1, show that Cov (Xt, Xs) = K (t,s) = cos(s-t) X(+) is not WSS.arrow_forward
 Algebra & Trigonometry with Analytic GeometryAlgebraISBN:9781133382119Author:SwokowskiPublisher:Cengage
 Holt Mcdougal Larson Pre-algebra: Student Edition...AlgebraISBN:9780547587776Author:HOLT MCDOUGALPublisher:HOLT MCDOUGAL
 Mathematics For Machine TechnologyAdvanced MathISBN:9781337798310Author:Peterson, John.Publisher:Cengage Learning,
 Trigonometry (MindTap Course List)TrigonometryISBN:9781305652224Author:Charles P. McKeague, Mark D. TurnerPublisher:Cengage Learning