Concept explainers
Videos
Measuring Area from a Boundary: The Planimeter
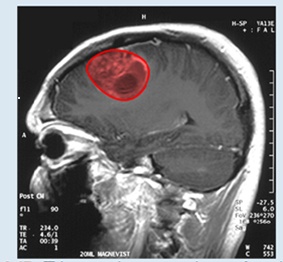
Figure 6.47 This magnetic resonance image of a patient’s brain shows a tumor, which is highlighted in red. (credit: modification of wood’ by Christaras A Wikimedia Commons)
Imagine you are a doctor who has just received a magnetic resonance image of your patent’s brain. The brain has a tumor (Figure 6.47). How large is the tumor? To be precise, what is the area of the red region? The red cross-section of the tumor has an irregular shape, and therefore it is unlikely that you would be able o find a set of equations or inequalities for the region and then be able to calculate its area by conventional means. You could approximate the area by chopping the region into tiny squares (a Riemann sum approach), but this method always gives an answer with some error.
Instead of trying to measure the area of the region directly, we can use a device called a rolling planimeter to calculate the area of the region exactly, simply by measuring its boundary. In this project you investigate how a planimeter works, and you use Green’s theorem to show the device calculates area correctly.
A rolling planimeter is a device that measures the area of a planar region by tracing out the boundary of that region (Figure 6.48). To measure the area of a region, we simply run the tracer of the planimeter around the boundary of the region. The planimeter measures the number of turns through which the wheel rotates as we (race the boundary; the area of the shape is proportional to this number of wheel ruins. We can derive the precise proportionality equation using Green’s theorem. As the (racer moves around the boundary of the region, the tracer arm rotates and the roller moves back and forth (but does no; rotate).
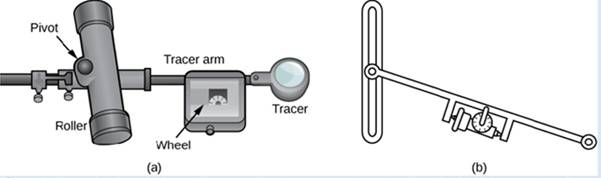
Figure 6.48 (a) A rolling planimeter. The pivot allows the tracer arm to rotate. The roller itself does not rotate; it only moves back and forth. (b) An interior view of a rolling planimeter. Notice that the wheel cannot rum if the planimeter is moving back and forth th the tracer arm perpendicular to the roller.
Let C denote the boundary of region D. the area to be calculated. As the tracer traverses curve C, assume the roller moves along the y-axis (since the roller does not rotate, one can assume it moves along a straight line). Use the coordinates (x, y) to represent points on boundary C, and coordinates (0, y) to represent the position of the pivot. As the planimeter traces C. the pivot moves along the y-axis while the tracer arm rotates on the pivot.  Watch a short animation (http://www.openstaxcollege.org/I/20_pianimeter) of a planimeter in action. Begin the analysis by considering the motion of the tracer as it moves from point (x, y) counterclockwise to point (x + dx. y + dy) that is close to (x, y) (Figure 6.49). The pivot also moves, from point (0, y) to nearby point (0, y + dy). How much does the wheel turn as a result of this motion? To answer this question, break the motion into two parts. First, roll the pivot along they-axis from (0. y) to (0, y + dy) without rotating the tracer arm. The tracer arm then ends up a point (x, y + dy) while maintaining a constant angle with the x-axis. Second, rotate the tracer arm by an angle d
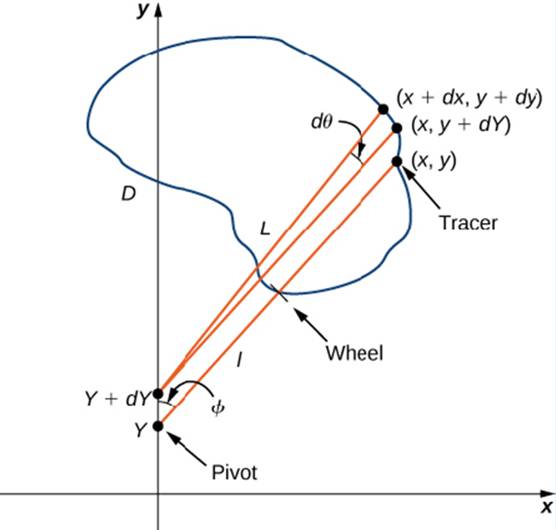
Figure 6.49 Mathematical analysis of the motion of the planimeter.
5. Assume the orientation of the planimeter is as shown in Figure 6.49. Explain why

Trending nowThis is a popular solution!

Chapter 6 Solutions
Calculus Volume 3
Additional Math Textbook Solutions
Elementary Statistics (13th Edition)
Elementary Statistics: Picturing the World (7th Edition)
Calculus: Early Transcendentals (2nd Edition)
A First Course in Probability (10th Edition)
University Calculus: Early Transcendentals (4th Edition)


- Find the Laplace Transform of the function to express it in frequency domain form.arrow_forwardPlease draw a graph that represents the system of equations f(x) = x2 + 2x + 2 and g(x) = –x2 + 2x + 4?arrow_forwardGiven the following system of equations and its graph below, what can be determined about the slopes and y-intercepts of the system of equations? 7 y 6 5 4 3 2 -6-5-4-3-2-1 1+ -2 1 2 3 4 5 6 x + 2y = 8 2x + 4y = 12 The slopes are different, and the y-intercepts are different. The slopes are different, and the y-intercepts are the same. The slopes are the same, and the y-intercepts are different. O The slopes are the same, and the y-intercepts are the same.arrow_forward
- Choose the function to match the graph. -2- 0 -7 -8 -9 --10- |--11- -12- f(x) = log x + 5 f(x) = log x - 5 f(x) = log (x+5) f(x) = log (x-5) 9 10 11 12 13 14arrow_forwardQ2 H let x(+) = &cos (Ait+U) and. 4(+) = ß cos(12t +V), where d. B. 1. In Constants and U,V indep.rus have uniform dist. (-π,π) Show that: ①Rxy (+,4+1)=0 @ Rxy (++) = cos [ when U=V Q3 let x(t) is stochastic process with Wss -121 e, and Rx ltst+1) = ( 2, show that E(X) = E(XS-X₁)² = 2(-1). Qu let x(t) = U Cost + (V+1) Sint, tεIR. where UV indep.rus, and let E (U)-E(V)=0 and E(U) = E(V) = 1, show that Cov (Xt, Xs) = K (t,s) = cos(s-t) X(+) is not WSS.arrow_forwardWhich of the following represents the graph of f(x)=3x-2? 7 6 5 4 ++ + + -7-6-5-4-3-2-1 1 2 3 4 5 6 7 -2 3 -5 6 -7 96 7 5 4 O++ -7-6-5-4-3-2-1 -2 -3 -4 -5 -7 765 432 -7-6-5-4-3-2-1 -2 ++ -3 -4 -5 -6 2 3 4 5 6 7 7 6 2 345 67 -7-6-5-4-3-2-1 2 3 4 5 67 4 -5arrow_forward
- 21. find the mean. and variance of the following: Ⓒ x(t) = Ut +V, and V indepriv. s.t U.VN NL0, 63). X(t) = t² + Ut +V, U and V incepires have N (0,8) Ut ①xt = e UNN (0162) ~ X+ = UCOSTE, UNNL0, 62) SU, Oct ⑤Xt= 7 where U. Vindp.rus +> ½ have NL, 62). ⑥Xn = ΣY, 41, 42, 43, ... Yn vandom sample K=1 Text with mean zen and variance 6arrow_forwardA psychology researcher conducted a Chi-Square Test of Independence to examine whether there is a relationship between college students’ year in school (Freshman, Sophomore, Junior, Senior) and their preferred coping strategy for academic stress (Problem-Focused, Emotion-Focused, Avoidance). The test yielded the following result: image.png Interpret the results of this analysis. In your response, clearly explain: Whether the result is statistically significant and why. What this means about the relationship between year in school and coping strategy. What the researcher should conclude based on these findings.arrow_forwardA 20 foot ladder rests on level ground; its head (top) is against a vertical wall. The bottom of the ladder begins by being 12 feet from the wall but begins moving away at the rate of 0.1 feet per second. At what rate is the top of the ladder slipping down the wall? You may use a calculator.arrow_forward
- A school counselor is conducting a research study to examine whether there is a relationship between the number of times teenagers report vaping per week and their academic performance, measured by GPA. The counselor collects data from a sample of high school students. Write the null and alternative hypotheses for this study. Clearly state your hypotheses in terms of the correlation between vaping frequency and academic performance. EditViewInsertFormatToolsTable 12pt Paragrapharrow_forwardPlease help solve the following whilst showing all working out. Is part of exam revision questions but no solution is givenarrow_forwardplease help me with this question with working out thanksarrow_forward
 Algebra & Trigonometry with Analytic GeometryAlgebraISBN:9781133382119Author:SwokowskiPublisher:Cengage
 Holt Mcdougal Larson Pre-algebra: Student Edition...AlgebraISBN:9780547587776Author:HOLT MCDOUGALPublisher:HOLT MCDOUGAL
 Mathematics For Machine TechnologyAdvanced MathISBN:9781337798310Author:Peterson, John.Publisher:Cengage Learning,
 Trigonometry (MindTap Course List)TrigonometryISBN:9781305652224Author:Charles P. McKeague, Mark D. TurnerPublisher:Cengage Learning