Interpretation:
Thelaw of multiple proportions should be explained with a graph.
Concept introduction:
Visual display of data is defined as a graph. By using the given data, a student can create graph. Graph helps to understand any data easily.
Answer to Problem 30SSC
The graph representation for the law of multiple can be explained by taking the example of
Explanation of Solution
According to the law of multiple proportions, the compositions of
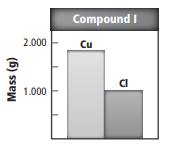
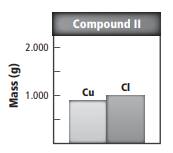
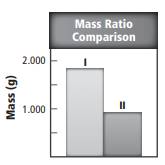
The mass of Cu in compound I and compound II the mass is different means in both compounds the elements are same but their mass ratio is different. The mass of Cu in compound I two times the mass of Cu in compound II which is created in the graph.
The required graph for compound I:

The required graph for compound II:

The required graph for Mass Ratio comparison:

The graph representation is an easy way to determine the difference between any types of value just like the law of multiple proportions is explained by the graphical representation of mass ratio.
Chapter 3 Solutions
Chemistry: Matter and Change
Additional Science Textbook Solutions
Physics for Scientists and Engineers: A Strategic Approach, Vol. 1 (Chs 1-21) (4th Edition)
Introductory Chemistry (6th Edition)
Microbiology with Diseases by Body System (5th Edition)
College Physics: A Strategic Approach (3rd Edition)
Campbell Biology (11th Edition)
Campbell Biology: Concepts & Connections (9th Edition)
- 3. Synthesize the following synthon from the indicated starting material. i HO.arrow_forwardIdentifying the stereochemistry of natural Write the complete common (not IUPAC) name of each molecule below. Note: if a molecule is one of a pair of enantiomers, be sure you start its name with D- or L- so we know which enantiomer it is. molecule H O-C-CH2 H3N. HN N H C=O common name (not the IUPAC name) NH3 ☐ H3N H ☐ CH2 Xarrow_forward> Draw the structure of alanine at pH 1.2. Click and drag to start drawing a structure.arrow_forward
- Understanding the general acid-base properties of amino acids O Proteins Imagine each of the molecules shown below was found in an aqueous solution. Can you tell whether the solution is acidic, basic, or neutral? molecule The solution is... 010 H3N-CH-C-OH CH HO CH3 O acidic O basic neutral O (unknown) H3N HO 0 O acidic O basic neutral ○ (unknown) H3N-CH-C-O CH2 CH3-CH-CH3 O acidic O basic Oneutral ○ (unknown) O= X H2N-CH-C-O CH3 CH CH3 acidic O basic O neutral ○ (unknown) ? 000arrow_forwardImagine each of the molecules shown below was found in an aqueous solution. Can you tell whether the solution is acidic, basic, or neutral? molecule 0=0 H3N-CH-C-o HO CH2 OH The solution is... O acidic O basic O neutral O (unknown) H₂N acidic O basic O neutral ○ (unknown) + H3N O OH O acidic O basic O neutral O (unknown) H2N-CH-C-O CH3 O acidic O basic neutral ○ (unknown) X ? olo HEarrow_forwardRecognizing ampli Draw an a amino acid with a methyl (-CH3) side chain. Explanation Check Click and drag to start drawing a structure. X Carrow_forward
- Write the systematic name of each organic molecule: structure name × HO OH ☐ OH CI CI O CI OH OHarrow_forwardく Check the box under each a amino acid. If there are no a amino acids at all, check the "none of them" box under the table. Note for advanced students: don't assume every amino acid shown must be found in nature. COO H3N-C-H CH2 HO CH3 NH3 O CH3-CH CH2 OH Onone of them Explanation Check + H3N O 0. O OH + NH3 CH2 CH3-CH H2N C-COOH H O HIC + C=O H3N-C-O CH3- - CH CH2 OH Х 2025 McGraw Hill LLC. All Rights Reserved. Terms of Use | Privacy Center Accesarrow_forwardWrite the systematic name of each organic molecule: structure HO-C-CH2-CH3 O -OH CH3-CH2-CH2-CH2-CH2-C-OH CH3 CH3-CH-CH2-C-OH Explanation Check S namearrow_forward
- theres 2 productsarrow_forwardDraw the major product of this solvolysis reaction. Ignore any inorganic byproducts. + CH3CH2OH Drawing Q Atoms, Bonds and Rings OCH2CH3 || OEt Charges OH 00-> | Undo Reset | Br Remove Done Drag To Pan +arrow_forwardDraw the major product of this SN1 reaction. Ignore any inorganic byproducts. CH3CO2Na CH3CO2H Drawing + Br Q Atoms, Bonds and Rings OAC Charges OH ОАс Na ဂ Br Undo Reset Remove Done Drag To Pan +arrow_forward
 ChemistryChemistryISBN:9781305957404Author:Steven S. Zumdahl, Susan A. Zumdahl, Donald J. DeCostePublisher:Cengage Learning
 ChemistryChemistryISBN:9781259911156Author:Raymond Chang Dr., Jason Overby ProfessorPublisher:McGraw-Hill Education
 Principles of Instrumental AnalysisChemistryISBN:9781305577213Author:Douglas A. Skoog, F. James Holler, Stanley R. CrouchPublisher:Cengage Learning
 Organic ChemistryChemistryISBN:9780078021558Author:Janice Gorzynski Smith Dr.Publisher:McGraw-Hill Education
 Chemistry: Principles and ReactionsChemistryISBN:9781305079373Author:William L. Masterton, Cecile N. HurleyPublisher:Cengage Learning
 Elementary Principles of Chemical Processes, Bind...ChemistryISBN:9781118431221Author:Richard M. Felder, Ronald W. Rousseau, Lisa G. BullardPublisher:WILEY


