Videos
a.
To create a
a.
Answer to Problem 79E

Explanation of Solution
Given information:
The number N (in millions) of students enrolled in schools in the United States from 2000 through 2009 are shown in the table:
YearNumber,N200072.2200173.1200274.0200374.9200475.5200575.8200675.2200776.0200876.3200977.3
Use a graphing data utility to create a scatter plot of the data. Let t represent the year, with t=0 corresponding to 2000 .
Calculation:
Here, we will consider the following table:
YearNumber,N200072.2200173.1200274.0200374.9200475.5200575.8200675.2200776.0200876.3200977.3
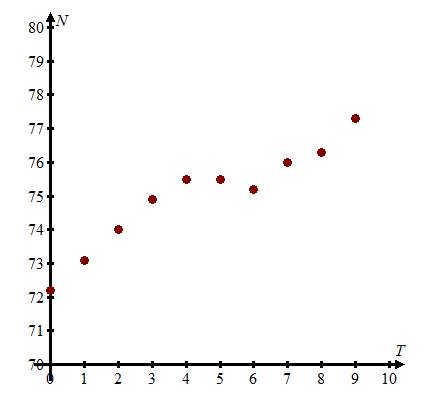
Hence, the result is shown in the graph.
b.
To find a quartic model for the data by using regression feature of the graphing utility.
b.
Answer to Problem 79E
N=0.00406t4−0.0564t3+0.147t2+0.86t+72.2
Explanation of Solution
Given information:
The number N (in millions) of students enrolled in schools in the United States from 2000 through 2009 are shown in the table:
YearNumber,N200072.2200173.1200274.0200374.9200475.5200575.8200675.2200776.0200876.3200977.3
Use the regression feature of the graphing utility to find a quartic model for the data. (A quartic model has the form at4+bt3+ct2+dt+e , where a,b,c,d and e are constant and t is variable.)
Calculation:
By using the regression feature of the graphing utility a quartic model for the data is given by:
N=0.00406t4−0.0564t3+0.147t2+0.86t+72.2 .
Hence, the result is N=0.00406t4−0.0564t3+0.147t2+0.86t+72.2 .
c.
How well does the model fit the data?
c.
Answer to Problem 79E

Explanation of Solution
Given information:
The number N (in millions) of students enrolled in schools in the United States from 2000 through 2009 are shown in the table:
YearNumber,N200072.2200173.1200274.0200374.9200475.5200575.8200675.2200776.0200876.3200977.3
Graph the model and the scatter plot in the same viewing window. How well does the model fit the data?
Calculation:
The graph of the model on the same scatter plot is shown below:
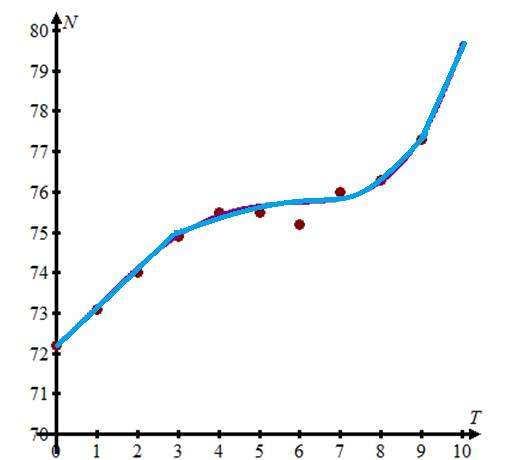
Hence, from the above graph we can observe that the model fits the data very closely.
d.
To find when did the number of students enrolled in the schools exceed 74 million?
d.
Answer to Problem 79E
Year2001
Explanation of Solution
Given information:
The number N (in millions) of students enrolled in schools in the United States from 2000 through 2009 are shown in the table:
YearNumber,N200072.2200173.1200274.0200374.9200475.5200575.8200675.2200776.0200876.3200977.3
According to the model, when did the number of students enrolled in the schools exceed 74 million?
Calculation:
Hence, by using the zoom and trace features, the number of students enrolled in schools exceeded 74 million in the year 2001 .
e.
To find if the model is valid for long-term predictions of student enrollment?
e.
Answer to Problem 79E
No, the model is not valid.
Explanation of Solution
Given information:
The number N (in millions) of students enrolled in schools in the United States from 2000 through 2009 are shown in the table:
YearNumber,N200072.2200173.1200274.0200374.9200475.5200575.8200675.2200776.0200876.3200977.3
Is the model valid for long-term predictions of student enrollment? Explain.
Calculation:
No, the model is not valid for long-term predictions of student enrollment. As, the numbers predicted by the model increase very fast while estimated far into the future which may not be correct.
Hence, the model is not valid for long-term predictions of student enrollment.
Chapter 2 Solutions
Precalculus with Limits


- quick solve thisarrow_forwardquick solve thisarrow_forwardThis table displays the current in equal intervals. Time t/ms 05 10 15 20 25 30 Current i/A 0 4.8 9.1 12.7 8.8 3.5 0 The formula for the charge as follows: 30x10-3 q 0 i dt Use formula to solve the current at 30ms using both the trapezoidal rule and Simpson's rule showing all steps and workingarrow_forward
 Calculus: Early TranscendentalsCalculusISBN:9781285741550Author:James StewartPublisher:Cengage Learning
 Thomas' Calculus (14th Edition)CalculusISBN:9780134438986Author:Joel R. Hass, Christopher E. Heil, Maurice D. WeirPublisher:PEARSON
 Calculus: Early Transcendentals (3rd Edition)CalculusISBN:9780134763644Author:William L. Briggs, Lyle Cochran, Bernard Gillett, Eric SchulzPublisher:PEARSON
 Calculus: Early TranscendentalsCalculusISBN:9781319050740Author:Jon Rogawski, Colin Adams, Robert FranzosaPublisher:W. H. Freeman
 Calculus: Early Transcendental FunctionsCalculusISBN:9781337552516Author:Ron Larson, Bruce H. EdwardsPublisher:Cengage Learning