Concept explainers
Videos
a.
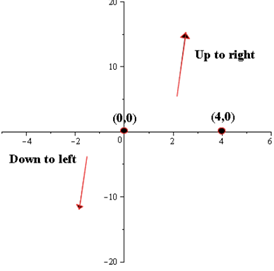
To sketch the graph of the function by applying the leading coefficient test.
a.
Explanation of Solution
Given Information:
The given polynomial function is-

Calculation:
Leading coefficient test-
The graph of the polynomial function 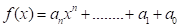 rises or falls eventually in the following way −
It depends on the value of  as
as  moves to the left or to the right without bound,
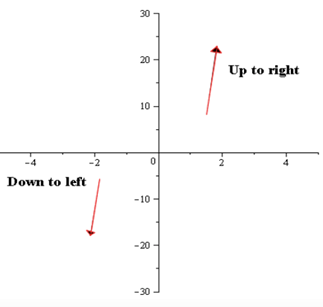
1. For positive leading coefficient is positive and odd the graph will rise to the right and will fall to the left and otherwise for the negative leading coefficient, the graph will rise to the left and will fall to the right.
2. For positive leading coefficient and even the graph will rise to the left and right and for the negative leading coefficient, the graph will fall to the left and right.
As the degree of polynomial is odd and the leading coefficient is positive, so by the leading coefficient test it can be concluded that the graph of the polynomial function will rise to the left and will fall to the right.
b.
To sketch the graph of the function by finding the zeroes of the polynomial,
b.
Explanation of Solution
Given Information:
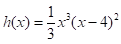
The given polynomial function is-
Calculation:
The real zeroes of the polynomial function can be determined by putting.
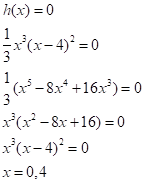
So, there are two real zeroes of the polynomial 
c.
To sketch the graph of the function by plotting sufficient solution points
c.
Explanation of Solution
Given Information:
The given polynomial function is-

Calculation:
The answers may vary as there are no fixed solution points.
d.
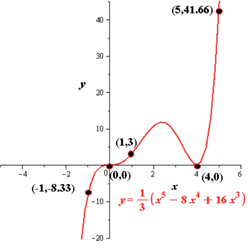
To sketch the graph of the function by drawing a continuous curve through the points.
d.
Explanation of Solution
Given Information:
The given polynomial function is-

Calculation:
The continuous plot of the polynomial function is,
Chapter 2 Solutions
Precalculus with Limits


- Given that 4−4i is a zero, factor the following polynomial function completely. Use the Conjugate Roots Theorem, if applicable. f(x)=x4−5x3−2x2+176x−320arrow_forwardeliminate the parameter to find the cartesian equation of the curve and sketch the graph. On the graph show the direction it takes and the initial and terminal point. Please draw by hand and show how you got to each steparrow_forwardeliminate the parameter to find the cartesian equation of the curve and sketch the graph. On the graph show the direction it takes and the initial and terminal point. Please draw by hand and show how you got to each steparrow_forward
- eliminate the parameter to find the cartesian equation of the curve and sketch the graph. On the graph show the direction it takes and the initial and terminal point. Please draw by hand and show how you got to each steparrow_forwardeliminate the parameter to find the cartesian equation of the curve and sketch the graph. On the graph show the direction it takes and the initial and terminal point. Please draw by hand and show how you got to each steparrow_forwardGraphically, explain the various forms of linear functionsarrow_forward
- 2. Find the Bezier surface equation using the 9 control points shown below. Use the u and v directions shown. It is required to show all the calculation processes for finding Bernstein polynomials. Find the surface tangent, twist and normal vectors at point u=0.5 and v=0.5. (40 points) y 10 9 8 7 6 5 4 3 2 Poo и 1 1 2 3 4 5 6 7 8 9 10 10 Xarrow_forwardA cable runs along the wall from C to P at a cost of $24 per meter, and straight from P to M at a cost of $26 per meter. If M is 10 meters from the nearest point A on the wall where P lies, and A is 72 meters from C, find the distance from C to P such that the cost of installing the cable is minimized and find this cost. C 72 P A 10 Marrow_forwardThe number of bank robberies in a country for the years 2010-2018 is given in the following figure. Consider the closed interval [2010,2018]. (a) Give all relative maxima and minima and when they occur on the interval. (b) Give the absolute maxima and minima and when they occur on the interval. Incidents 7000- 6000-5 5482 5000- 4424 4273 4822 4000- 3708 3748 4229 4089 3000- 2582 2000- 1000- 0 2010 2012 2014 2016 2018 Yeararrow_forward
- please do 8.1 q7arrow_forwardplease do 8.1 q6arrow_forwardIf the price charged for a candy bar is p(x) cents, then x thousand candy bars will be sold in a certain city, where p(x)=158- X 10° a. Find an expression for the total revenue from the sale of x thousand candy bars. b. Find the value of x that leads to maximum revenue. c. Find the maximum revenue.arrow_forward
 Calculus: Early TranscendentalsCalculusISBN:9781285741550Author:James StewartPublisher:Cengage Learning
 Thomas' Calculus (14th Edition)CalculusISBN:9780134438986Author:Joel R. Hass, Christopher E. Heil, Maurice D. WeirPublisher:PEARSON
 Calculus: Early Transcendentals (3rd Edition)CalculusISBN:9780134763644Author:William L. Briggs, Lyle Cochran, Bernard Gillett, Eric SchulzPublisher:PEARSON
 Calculus: Early TranscendentalsCalculusISBN:9781319050740Author:Jon Rogawski, Colin Adams, Robert FranzosaPublisher:W. H. Freeman
 Calculus: Early Transcendental FunctionsCalculusISBN:9781337552516Author:Ron Larson, Bruce H. EdwardsPublisher:Cengage Learning