Concept explainers
Videos
a.
Use the regression feature of a graphing utility to find a quadratic model for the data.
a.
Answer to Problem 12PS
Explanation of Solution
Calculation:
Consider the following table;
Use graphing utility Ti-83 to create the
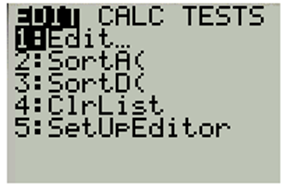
Go to STAT and select EDIT
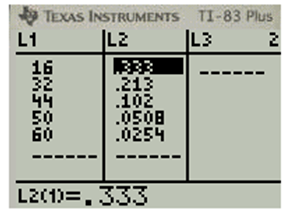
Then enter the data in the L1 as year and L2 as sales in that list. The list look like below:
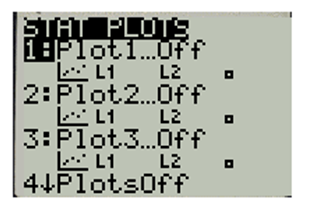
Now, go to the STAT PLOT and choose Plot1.......Off.
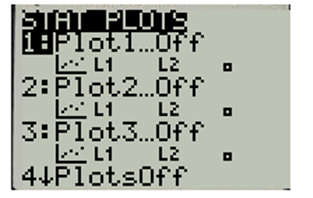
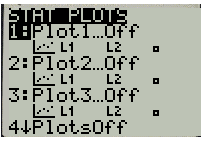
Now, ENTER and turn ON Plot-1
Select the first type of Plot and turn off the other types.

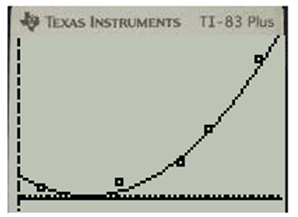
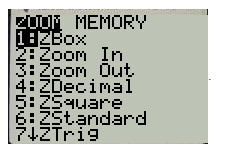
Now, go to ZOOM option and choose ZOOMSTAT:
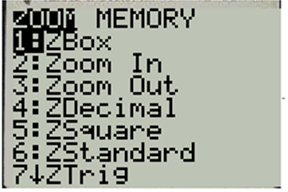
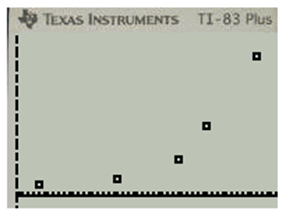
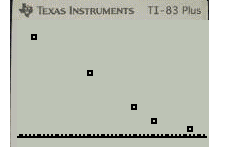
Put ENTER and you will get the plot as below:
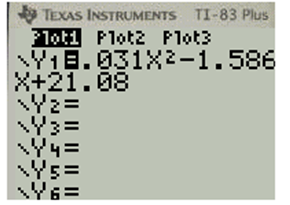
Use regression option and find the quadratic regression for the data:
Then again go to the STAT option and go to CALC option.
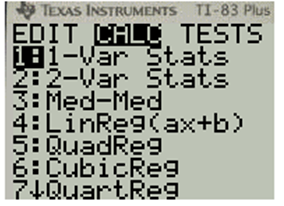
Then go to the QuadReg option, thyen go to VARS option and then Function-
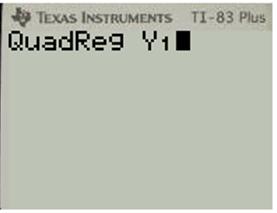
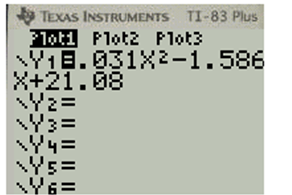
Then put ENTER. You will get the equation as below:
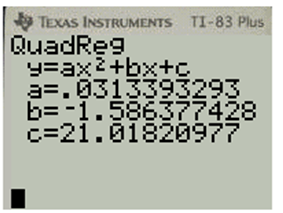
Hence, the
Now, graph the model in same viewing model. So, go the
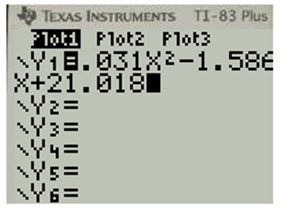
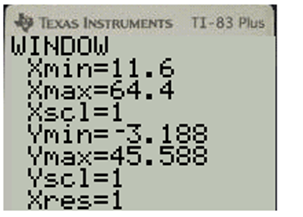
Now, do not change the WINDOW as the window is already adjusted to the scattered plot. So,
You will get the WINDOW as:
Now, go to GRAPH option and you will get the plot as:

Hence, now you can see that it almost goes with the scattered plot. So, it fit the data well.
b.
Use the graphing utility to plot the data and graph the model in the same viewing window.
b.
Answer to Problem 12PS

Explanation of Solution
Calculation:
Consider the following table;
Find the rational model of the data. So, the rational model will be as below:
Here
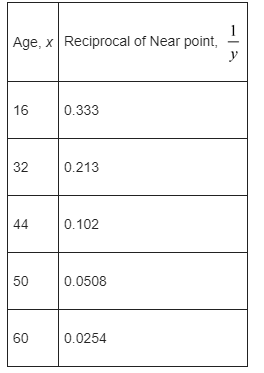
Now, consider
So, the reciprocal of
So, the new table is:
Use graphing utility Ti-83 to create the scatter plot.
Go to STAT and select EDIT.
Then enter the data in the L1 as year and L2 as sales in that list. The list will look like below:
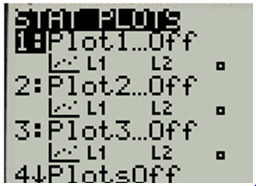
Now, go to the STAT PLOT and choose Plot1...Off.
Now, ENTER and turn ON Plot-1
Select the first type of plot and turn off the other types.

Now, go to the Zoom option and choose ZOOMSTAT
Put ENTER and you will get the plot as below:
Now, use regression option and find the linear regression for the data:
Then again go to the STAT option and go to CALC option.
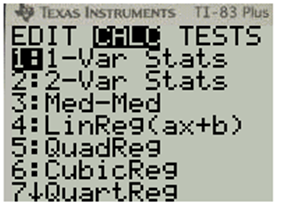
Then go to the LinReg(ax+b)option, then go VARS option and then Function-
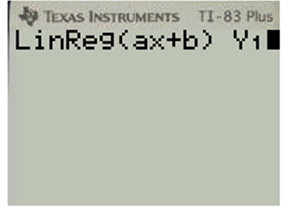
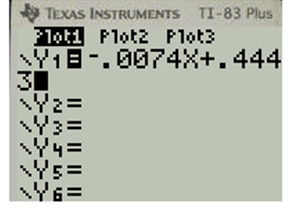
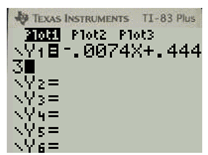
Then put ENTER. You will get the equation as below:
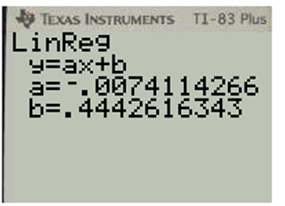
So, the rational equation is :
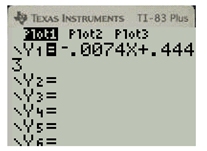
Now, graph the model in the same viewing model. So, go to the Y= option and pit the function as below:
Now, do not change the WINDOW as the window is already adjusted to the scattered plot. So, you will get the WINDOW as:
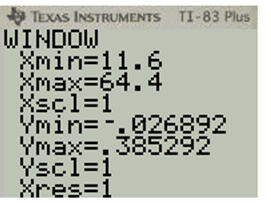
Now, go to GRAPH option and you will get the plot as:
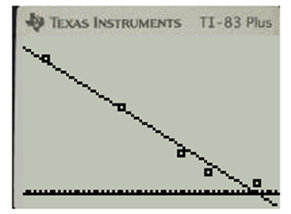
Hence, now you can see that it almost goes with the scattered plot. So, it fit the data well.
c.
Verify that the model fit the data.
c.
Answer to Problem 12PS
The data match the quadratic model.
Explanation of Solution
Calculation:
Consider the quadratic model
Go to the TABLE option of this and get the table as:
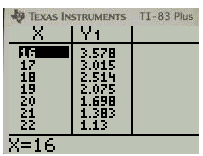
Now, from the table get the values as
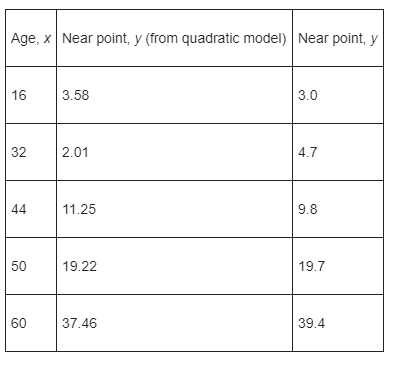
Hence, here at lower age, the data matches the rational model at the higher age, the data match the quadratic model.
d.
Use both models to estimate the near point for a person
d.
Answer to Problem 12PS
Explanation of Solution
Calculation:
Consider the quadratic model:
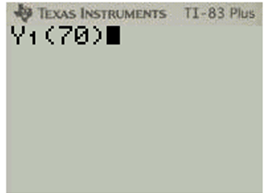
Find the near point of the person who is
Now, go to QUIT option. Then go to VARS option and then Function-
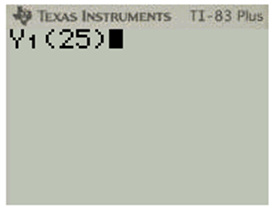
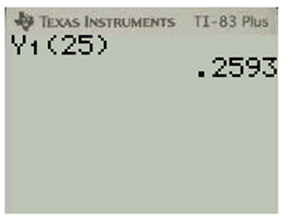
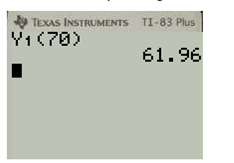
Put ENTER and you will get:
Hence, according model, the near point is at
Consider the rational model
Find the near point of the person who is
Now, go to QUIT option. Then go to VARS option and then Function-
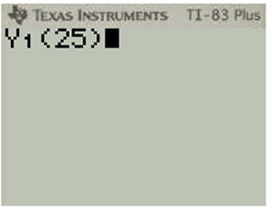
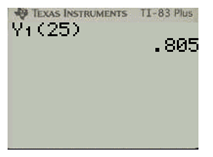
Put ENTER and you will get:
So, you get:
Hence, according to rational model, the near point is at
Predict the near point for a person
Answer to Problem 12PS
Only Quadratic model will fit at the age of
Explanation of Solution
Calculation:
Consider the quadratic model:
Find the near point of the person who is
Now, go to QUIT option. Then go to VARS option and then Function-
Put ENTER and you will get
Hence, according to quadratic model, the near point is at
Consider the rational model
Find the near point of the person who is
Now, go to QUIT option. Then go to VARS option and then Function-
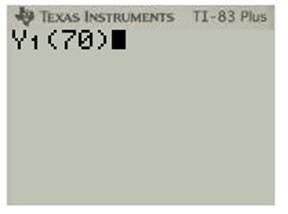
Put ENTER and you will get
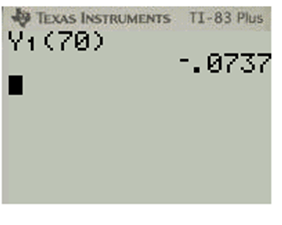
This is absurd.
Hence, only quadratic will fit at the age of
Chapter 2 Solutions
Precalculus with Limits


- A helicopter pilot needs to travel to a regional airport 25 miles away. She flies at an actual heading of N16.26°E with an airspeed of 110 mph, and there is a wind blowing directly east at 20 mph. (a) Determine the compass heading that the pilot needs to reach her destination. (b) How long will it take her to reach her destination?arrow_forwardQuestion 3. the given integral is convergent or divergent: Use the comparison test to determine whether or not * sin*(x + 1) 7x3 (a) |. d.x g8 + x4 + 1 -dx (b) 2.x4 + x + 1arrow_forward-d.x tan xarrow_forward
- 48. f(x) = { 4 x if x < 2 2x 2 if x 2arrow_forwardГ 49. -x+1 if x 1 Answer ->arrow_forwardA Content X MindTap - Cengage Learning x Function Evaluations x + /ui/evo/index.html?elSBN=9780357038406&id=339416021&snapshotld=877369& GE MINDTAP , Limits, and the Derivative ⭑ វា a ANSWEI 16. Refer to the graph of the function f in the following figure. कर्ट AA C 54 -3-2 7 7 Ay 6. S 5. y=f(x) 4 3. 2. 1 -3- 34567 8 00 9 10 a. Find the value of ƒ (7). b. Find the values of x corresponding to the point(s) on the graph of ƒ located at a height of 5 units from the x-axis. c. Find the point on the x-axis at which the graph of ƒ crosses it. What is the value of f (x) at this point? d. Find the domain and range of f. MacBook Pro G Search or type URL + > % Λ & 5 6 7 29 ( 8 9 0arrow_forward
- Morgan F. - C X A Courses MindTap - Cengage Learning Х Domain of Square Roots X + gage.com/static/nb/ui/evo/index.html?elSBN 9780357038406&id=339416021&snapshotld=877369& CENGAGE MINDTAP 2: Functions, Limits, and the Derivative 47. x if x < 0 f(x) = 2x+1 if x 0 Answerarrow_forwardA Content MindTap - Cengage Learning × Function Evaluations * + c/nb/ui/evo/index.html?elSBN 9780357038406&id=339416021&snapshotld=877369& GAGE MINDTAP ions, Limits, and the Derivative 15. Refer to the graph of the function f in the following figure. 6 y = f(x) 5 4+ 3- 2- 1 + 2 -1 3 4 5 6 a. Find the value of ƒ (0). Answer-> b. Find the value of x for which (i) f (x) = 3 and (ii) f (x) = 0. Answer ▾ c. Find the domain of f. Answer + d. Find the range of f. Answer+ MacBook Proarrow_forwardAnswer-> 12. Let g be the function defined by Find g(-2), g(0), g (2), and g (4). - +1 if x <2 g(x) = √√√x-2 if x 2arrow_forward
 Calculus: Early TranscendentalsCalculusISBN:9781285741550Author:James StewartPublisher:Cengage Learning
 Thomas' Calculus (14th Edition)CalculusISBN:9780134438986Author:Joel R. Hass, Christopher E. Heil, Maurice D. WeirPublisher:PEARSON
 Calculus: Early Transcendentals (3rd Edition)CalculusISBN:9780134763644Author:William L. Briggs, Lyle Cochran, Bernard Gillett, Eric SchulzPublisher:PEARSON
 Calculus: Early TranscendentalsCalculusISBN:9781319050740Author:Jon Rogawski, Colin Adams, Robert FranzosaPublisher:W. H. Freeman
 Calculus: Early Transcendental FunctionsCalculusISBN:9781337552516Author:Ron Larson, Bruce H. EdwardsPublisher:Cengage Learning