Concept explainers
Videos
(a)
The graph of the function applying the lead coefficient test.
(a)
Explanation of Solution
Given information:
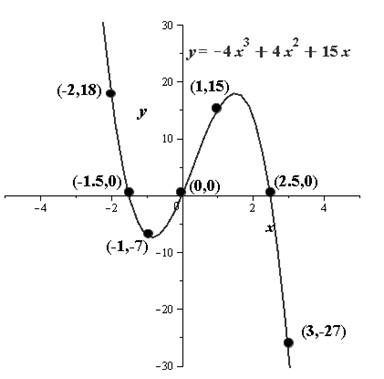
The polynomial function as given below,
Formula used:
The horizontal axis represents the x- axis and the vertical axis represents the y-axis.
Calculation:
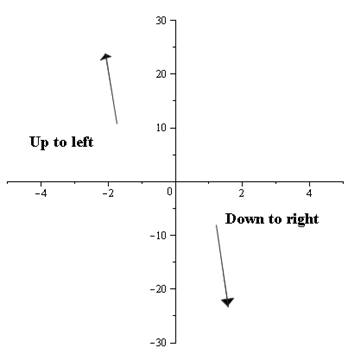
The leading coefficient test says that: 1- If the degree of the polynomial is even and the leading coefficient is positive, both ends of the graph rise up. 2. If the degree is even and the leading coefficient is negative, both ends of the graph fall down. 3- If the degree is odd and the leading coefficient is positive, the left side of the graph falls down and the right side rises up. 4. If the degree is odd and the leading coefficient is negative, the left side of the graph rises up and the right side falls down.
As the leading coefficient is negative and degree is odd, the graph rises up on the left side and falls down on the right.
The graph’s ends would be as shown below:
Conclusion:
The graph is plotted against the II and IV quadrant.
(b)
The real zeros of the polynomial.
(b)
Answer to Problem 82E
The value of x is
Explanation of Solution
Given information:
The polynomial function as given below,
Formula used:
The polynomial is equated to zero.
Calculation:
The leading coefficient test says that: 1- If the degree of the polynomial is even and the leading coefficient is positive, both ends of the graph rise up. 2. If the degree is even and the leading coefficient is negative, both ends of the graph fall down. 3- If the degree is odd and the leading coefficient is positive, the left side of the graph falls down and the right side rises up. 4. If the degree is odd and the leading coefficient is negative, the left side of the graph rises up and the right side falls down.
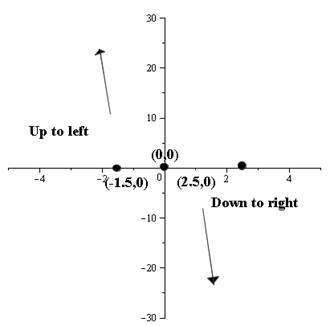
Putting
Adding these points to the graph, the graph would be as shown below,
Conclusion:
The value of x is
(c)
The plotting of sufficient solution points.
(c)
Answer to Problem 82E
The graphs get increases and decreases continuously.
Explanation of Solution
Given information:
The polynomial function as given below,
Formula used:
The horizontal axis represent the x-axis and the vertical axis represent the y-axis.
Calculation:
The leading coefficient test says that: 1- If the degree of the polynomial is even and the leading coefficient is positive, both ends of the graph rise up. 2. If the degree is even and the leading coefficient is negative, both ends of the graph fall down. 3- If the degree is odd and the leading coefficient is positive, the left side of the graph falls down and the right side rises up. 4. If the degree is odd and the leading coefficient is negative, the left side of the graph rises up and the right side falls down.
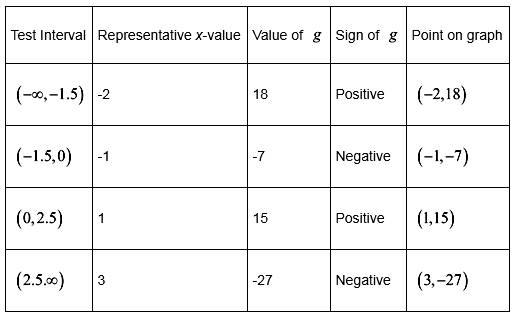
The polynomial function is evaluated at the values chosen between the test intervals. And the test interval is determined by the values of the zeros. Consider the table of values shown below:
Conclusion:
The graphs get increases and decreases continuously.
(d)
The continuous curve through the points.
(d)
Answer to Problem 82E
The graph cuts the x-axis at
Explanation of Solution
Given information:
The polynomial function as given below,
Formula used:
The zeros are of odd multiplicity
Calculation:
The leading coefficient test says that: 1- If the degree of the polynomial is even and the leading coefficient is positive, both ends of the graph rise up. 2. If the degree is even and the leading coefficient is negative, both ends of the graph fall down. 3- If the degree is odd and the leading coefficient is positive, the left side of the graph falls down and the right side rises up. 4. If the degree is odd and the leading coefficient is negative, the left side of the graph rises up and the right side falls down.
A continuous curve through the points obtained in the table is drawn. It is to be noted that as all the zeros are of odd multiplicity, the graph cuts the x-axis at
The graph is as shown below:
Conclusion:
The graph cuts the x-axis at
Chapter 2 Solutions
Precalculus with Limits


- 2. Find the Bezier surface equation using the 9 control points shown below. Use the u and v directions shown. It is required to show all the calculation processes for finding Bernstein polynomials. Find the surface tangent, twist and normal vectors at point u=0.5 and v=0.5. (40 points) y 10 9 8 7 6 5 4 3 2 Poo и 1 1 2 3 4 5 6 7 8 9 10 10 Xarrow_forwardA cable runs along the wall from C to P at a cost of $24 per meter, and straight from P to M at a cost of $26 per meter. If M is 10 meters from the nearest point A on the wall where P lies, and A is 72 meters from C, find the distance from C to P such that the cost of installing the cable is minimized and find this cost. C 72 P A 10 Marrow_forwardThe number of bank robberies in a country for the years 2010-2018 is given in the following figure. Consider the closed interval [2010,2018]. (a) Give all relative maxima and minima and when they occur on the interval. (b) Give the absolute maxima and minima and when they occur on the interval. Incidents 7000- 6000-5 5482 5000- 4424 4273 4822 4000- 3708 3748 4229 4089 3000- 2582 2000- 1000- 0 2010 2012 2014 2016 2018 Yeararrow_forward
- please do 8.1 q7arrow_forwardplease do 8.1 q6arrow_forwardIf the price charged for a candy bar is p(x) cents, then x thousand candy bars will be sold in a certain city, where p(x)=158- X 10° a. Find an expression for the total revenue from the sale of x thousand candy bars. b. Find the value of x that leads to maximum revenue. c. Find the maximum revenue.arrow_forward
- 3 The total profit P(X) (in thousands of dollars) from the sale of x hundred thousand automobile tires is approximated by P(x) = -x³ + 12x² + 60x - 200, x≥5. Find the number of hundred thousands of tires that must be sold to maximize profit. Find the maximum profit. The maximum profit is $ when hundred thousand tires are sold.arrow_forwardA fence must be built to enclose a rectangular area of 5000 ft². Fencing material costs $4 per foot for the two sides facing north and south and $8 per foot for the other two sides. Find the cost of the least expensive fence. The cost of the least expensive fence is $ (Simplify your answer.)arrow_forwardThe number of fish swimming upstream to spawn is approximated by the function given below, where x represents the temperature of the water in degrees Celsius. Find the water temperature that produces the maximum number of fish swimming upstream. F(x) = x3 + 3x² + 360x + 5017, 5≤x≤18arrow_forward
- A campground owner has 500 m of fencing. He wants to enclose a rectangular field bordering a river, with no fencing along the river. (See the sketch.) Let x represent the width of the field. (a) Write an expression for the length of the field as a function of x. (b) Find the area of the field (area = length x width) as a function of x. (c) Find the value of x leading to the maximum area. (d) Find the maximum area. x Riverarrow_forwardA rectangular tank with a square base, an open top, and a volume of 1372 ft³ is to be constructed of sheet steel. Find the dimensions of the tank that has the minimum surface area. The dimensions of the tank with minimum surface area are (Simplify your answer. Use a comma to separate answers.) ft.arrow_forwardWrite an equation for the function graphed below 5+ 4 - -7 -6 -5 -4 -3 -2 -1 y = 3. 2 1 + 1 2 3 4 5 6 7 -1 -3 -4 5 -5+ aarrow_forward
 Calculus: Early TranscendentalsCalculusISBN:9781285741550Author:James StewartPublisher:Cengage Learning
 Thomas' Calculus (14th Edition)CalculusISBN:9780134438986Author:Joel R. Hass, Christopher E. Heil, Maurice D. WeirPublisher:PEARSON
 Calculus: Early Transcendentals (3rd Edition)CalculusISBN:9780134763644Author:William L. Briggs, Lyle Cochran, Bernard Gillett, Eric SchulzPublisher:PEARSON
 Calculus: Early TranscendentalsCalculusISBN:9781319050740Author:Jon Rogawski, Colin Adams, Robert FranzosaPublisher:W. H. Freeman
 Calculus: Early Transcendental FunctionsCalculusISBN:9781337552516Author:Ron Larson, Bruce H. EdwardsPublisher:Cengage Learning