Concept explainers
Videos
a.
Use a graphing utility to create a
a.
Answer to Problem 86E
Explanation of Solution
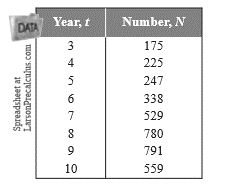
Given information:
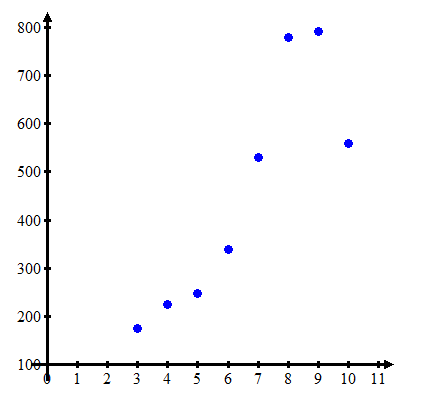
The numbers of confirmed cases of Lyme disease in Maine from

Use a graphing utility to create a scatter plot of the data
Calculation:
Consider the given table,
Using a graphing utility to create a scatter plot.

Hence, the solution is plot.
b.
Find a quadratic model for the data.
b.
Answer to Problem 86E
Explanation of Solution
Given information:
The numbers of confirmed cases of Lyme disease in Maine from


Use the regression feature of the graphing utility to find a quadratic model for the data. Graph the model in the same viewing window as the scatter plot.
Calculation:
Use the regression feature of the graphing utility to find a quadratic model for the data
Using a graphing utility to create a scatter plot.
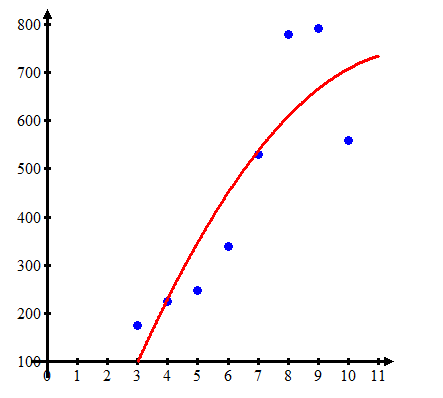
Hence, the solution is plot and
c.
Compare the model with the original data.
c.
Answer to Problem 86E
There is lot of variance between the model and original data.
Explanation of Solution
Given information:
The numbers of confirmed cases of Lyme disease in Maine from

Use the model to create a table of estimated values of
Calculation:
The model to create a table of estimated values of
From the table it is clear that there is lot of variance between the model and original data.
Hence, the solution is shown in table.
d.
Use synthetic division to confirm algebraically your estimated value for the year
d.
Answer to Problem 86E
Explanation of Solution
Given information:
The numbers of confirmed cases of Lyme disease in Maine from


Use synthetic division to confirm algebraically your estimated value for the year
Calculation:
Use synthetic division ,
Hence, the solution is
Chapter 2 Solutions
Precalculus with Limits


- A Content X MindTap - Cengage Learning x Function Evaluations x + /ui/evo/index.html?elSBN=9780357038406&id=339416021&snapshotld=877369& GE MINDTAP , Limits, and the Derivative ⭑ វា a ANSWEI 16. Refer to the graph of the function f in the following figure. कर्ट AA C 54 -3-2 7 7 Ay 6. S 5. y=f(x) 4 3. 2. 1 -3- 34567 8 00 9 10 a. Find the value of ƒ (7). b. Find the values of x corresponding to the point(s) on the graph of ƒ located at a height of 5 units from the x-axis. c. Find the point on the x-axis at which the graph of ƒ crosses it. What is the value of f (x) at this point? d. Find the domain and range of f. MacBook Pro G Search or type URL + > % Λ & 5 6 7 29 ( 8 9 0arrow_forwardMorgan F. - C X A Courses MindTap - Cengage Learning Х Domain of Square Roots X + gage.com/static/nb/ui/evo/index.html?elSBN 9780357038406&id=339416021&snapshotld=877369& CENGAGE MINDTAP 2: Functions, Limits, and the Derivative 47. x if x < 0 f(x) = 2x+1 if x 0 Answerarrow_forwardA Content MindTap - Cengage Learning × Function Evaluations * + c/nb/ui/evo/index.html?elSBN 9780357038406&id=339416021&snapshotld=877369& GAGE MINDTAP ions, Limits, and the Derivative 15. Refer to the graph of the function f in the following figure. 6 y = f(x) 5 4+ 3- 2- 1 + 2 -1 3 4 5 6 a. Find the value of ƒ (0). Answer-> b. Find the value of x for which (i) f (x) = 3 and (ii) f (x) = 0. Answer ▾ c. Find the domain of f. Answer + d. Find the range of f. Answer+ MacBook Proarrow_forward
- Answer-> 12. Let g be the function defined by Find g(-2), g(0), g (2), and g (4). - +1 if x <2 g(x) = √√√x-2 if x 2arrow_forward13. Let f be the function defined by Find f (-1), f (0), ƒ (1) and ƒ (2). Answer f(x) = .2 J-x² +3 if x <1 2x²+1 2x²+1 if x ≥ 1arrow_forwardΛ Content Mind Tap - Cengage Learning × Function Evaluations x + c/nb/ui/evo/index.html?elSBN 9780357038406&id=339416021&snapshotld=877369& GAGE MINDTAP ons, Limits, and the Derivative 14. Let f be the function defined by Find f (0), f (1), and f (2). 2+1 x if x 1 if x 1 f(x) = 1 1-xarrow_forward
- A Content c/nb/ui/evo/index.html?elSBN 9780357038406&id=339416021&snapshotld=877369& GAGE MINDTAP ons, Limits, and the Derivative 11. Let f be the function defined by Find f (-2), f (0), and f (1). Answer f(x) = [ x² + 1 if x ≤ 0 if x > 0arrow_forwardGiven that 4−4i is a zero, factor the following polynomial function completely. Use the Conjugate Roots Theorem, if applicable. f(x)=x4−5x3−2x2+176x−320arrow_forwardeliminate the parameter to find the cartesian equation of the curve and sketch the graph. On the graph show the direction it takes and the initial and terminal point. Please draw by hand and show how you got to each steparrow_forward
 Calculus: Early TranscendentalsCalculusISBN:9781285741550Author:James StewartPublisher:Cengage Learning
 Thomas' Calculus (14th Edition)CalculusISBN:9780134438986Author:Joel R. Hass, Christopher E. Heil, Maurice D. WeirPublisher:PEARSON
 Calculus: Early Transcendentals (3rd Edition)CalculusISBN:9780134763644Author:William L. Briggs, Lyle Cochran, Bernard Gillett, Eric SchulzPublisher:PEARSON
 Calculus: Early TranscendentalsCalculusISBN:9781319050740Author:Jon Rogawski, Colin Adams, Robert FranzosaPublisher:W. H. Freeman
 Calculus: Early Transcendental FunctionsCalculusISBN:9781337552516Author:Ron Larson, Bruce H. EdwardsPublisher:Cengage Learning