Concept explainers
Videos
Interpretation:
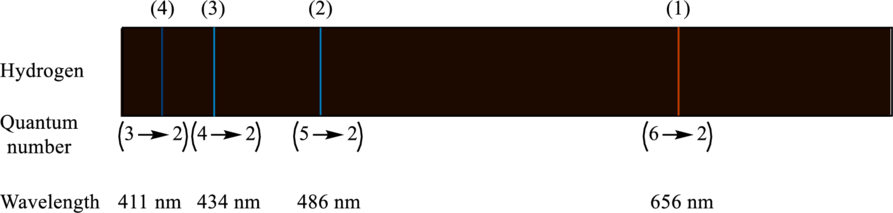
The wavelength, initial quantum number and the final quantum number in the visible spectrum of hydrogen have to be labeled.
Concept Introduction:
The wave nature of any light can be described by its frequency, wavelength, and amplitude. The wavelength
The relation between frequency
Here,
The relation between the energy
Here,
The energy of Bohr orbits of hydrogen is dependent on the principal quantum number
Answer to Problem 7.40QE
The labeled visible spectrum of hydrogen is as follows:
Explanation of Solution
The visible spectrum of hydrogen gives four lines that represent four transitions of the hydrogen as follows:
(1) Transition 1 is from
(2) Transition 1 is from
(3) Transition 1 is from
(4) Transition 1 is from
The expression to calculate the energy difference between initial Bohr orbit
Substitute
Hence, the expression to calculate energy difference between initial Bohr orbit
Here,
For transition (1):
Substitute 3 for
Substitute
Rearrange equation (6) to calculate the value of
Substitute
For transition (2):
Substitute 4 for
Substitute
For transition (3):
Substitute 5 for
Substitute
For transition (4):
Substitute 6 for
Substitute
Want to see more full solutions like this?
Chapter 7 Solutions
Chemistry: Principles and Practice


- What is the final product when D-galactose reacts with hydroxylamine?arrow_forwardIndicate the formula of the product obtained by reacting methyl 5-chloro-5-oxopentanoate with 1 mole of 4-penten-1-ylmagnesium bromide.arrow_forwardIn the two chair conformations of glucose, the most stable is the one with all the OH groups in the equatorial position. Is this correct?arrow_forward
- please help me with my homeworkarrow_forwardhelparrow_forwardThe temperature on a sample of pure X held at 1.25 atm and -54. °C is increased until the sample boils. The temperature is then held constant and the pressure is decreased by 0.42 atm. On the phase diagram below draw a path that shows this set of changes. pressure (atm) 2 0 0 200 400 temperature (K) Xarrow_forward
- QUESTION: Answer Question 5: 'Calculating standard error of regression' STEP 1 by filling in all the empty green boxes *The values are all provided in the photo attached*arrow_forwardpressure (atm) 3 The pressure on a sample of pure X held at 47. °C and 0.88 atm is increased until the sample condenses. The pressure is then held constant and the temperature is decreased by 82. °C. On the phase diagram below draw a path that shows this set of changes. 0 0 200 temperature (K) 400 аarrow_forwarder your payment details | bar xb Home | bartleby x + aleksogi/x/isl.exe/1o u-lgNskr7j8P3jH-1Qs_pBanHhviTCeeBZbufuBYT0Hz7m7D3ZcW81NC1d8Kzb4srFik1OUFhKMUXzhGpw7k1 O States of Matter Sketching a described thermodynamic change on a phase diagram 0/5 The pressure on a sample of pure X held at 47. °C and 0.88 atm is increased until the sample condenses. The pressure is then held constant and the temperature is decreased by 82. °C. On the phase diagram below draw a path that shows this set of changes. pressure (atm) 1 3- 0- 0 200 Explanation Check temperature (K) 400 X Q Search L G 2025 McGraw Hill LLC. All Rights Reserved Terms of Use Privacy Cearrow_forward
 Introductory Chemistry: An Active Learning Approa...ChemistryISBN:9781305079250Author:Mark S. Cracolice, Ed PetersPublisher:Cengage Learning
 World of Chemistry, 3rd editionChemistryISBN:9781133109655Author:Steven S. Zumdahl, Susan L. Zumdahl, Donald J. DeCostePublisher:Brooks / Cole / Cengage Learning
 Chemistry: The Molecular ScienceChemistryISBN:9781285199047Author:John W. Moore, Conrad L. StanitskiPublisher:Cengage Learning
 Chemistry: Matter and ChangeChemistryISBN:9780078746376Author:Dinah Zike, Laurel Dingrando, Nicholas Hainen, Cheryl WistromPublisher:Glencoe/McGraw-Hill School Pub Co
 Physical ChemistryChemistryISBN:9781133958437Author:Ball, David W. (david Warren), BAER, TomasPublisher:Wadsworth Cengage Learning,