
Videos
Use the table below to answer Questions 9 and 10.
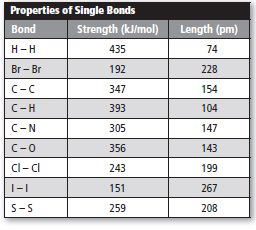
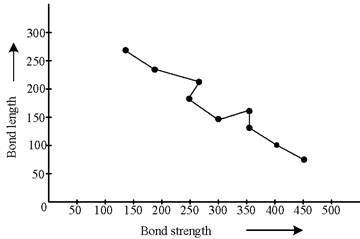
Create a graph to show how bond length varies withbond strength. Place bond strength on the x-axis.
Interpretation:
The graph plotted between bond length and bond strength needs to be explained.
Concept introduction:
The bond length is inversely proportion to bond strength.
Answer to Problem 9STP
The graph plotted between bond length and bond strength is follows as:
Explanation of Solution
Bond length is average distance between two nuclei bonded atoms while bond strength is the ability of bond which hold atoms together. Bond length depends upon differ factor such as electron affinity, size of atoms and difference between electro − negativity. In case of bond energy, higher the bond energy, shorter is the bond length.
Chapter 12 Solutions
Chemistry: Matter and Change
Additional Science Textbook Solutions
Campbell Biology: Concepts & Connections (9th Edition)
Microbiology: An Introduction
Anatomy & Physiology (6th Edition)
Human Anatomy & Physiology (2nd Edition)
Chemistry: A Molecular Approach (4th Edition)
Campbell Biology (11th Edition)


- x + LEKS: Using a phase diagram a X n/alekscgi/x/lsl.exe/10_u-IgNsikr7j8P3jH-IQs_pBan HhvlTCeeBZbufu BYTI0Hz7m7D3ZcHYUt80XL-5alyVpw ○ States of Matter Using a phase diagram to find a phase transition temperature or pressure Use the phase diagram of Substance X below to find the melting point of X when the pressure above the solid is 1.1 atm. pressure (atm) 16 08- solid liquid- 0 200 400 gas 600 temperature (K) Note: your answer must be within 25 °C of the exact answer to be graded correct. × 5arrow_forwardS: Using a phase diagram leksogi/x/sl.exe/1ou-IgNs kr 7j8P3jH-IQs_pBan HhvTCeeBZbufuBYTI0Hz7m7D3ZdHYU+80XL-5alyVp O States of Matter Using a phase diagram to find a phase transition temperature or pressure se the phase diagram of Substance X below to find the boiling point of X when the pressure on the liquid is 1.6 atm. pressure (atm) 32- 16- solid liquid 0. gas 100 200 temperature (K) 300 Note: your answer must be within 12.5 °C of the exact answer to be graded correct. 10 Explanation Check § Q Search J 2025 McGraw Hill LLC. All Rights Researrow_forward151.2 254.8 85.9 199.6 241.4 87.6 242.5 186.4 155.8 257.1 242.9 253.3 256.0 216.6 108.7 239.0 149.7 236.4 152.1 222.7 148.7 278.2 268.7 234.4 262.7 283.2 143.6 QUESTION: Using this group of data on salt reduced tomato sauce concentration readings answer the following questions: 1. 95% Cl Confidence Interval (mmol/L) 2. [Na+] (mg/100 mL) 3. 95% Na+ Confidence Interval (mg/100 mL)arrow_forward
- Results Search Results Best Free Coursehero Unloc xb Success Confirmation of Q x O Google Pas alekscgi/x/lsl.exe/1o_u-IgNslkr 7j8P3jH-IQs_pBanHhvlTCeeBZbufu BYTI0Hz7m7D3ZcHYUt80XL-5alyVpwDXM TEZayFYCavJ17dZtpxbFD0Qggd1J O States of Matter Using a phase diagram to find a phase transition temperature or pressure Gabr 3/5 he pressure above a pure sample of solid Substance X at 101. °C is lowered. At what pressure will the sample sublime? Use the phase diagram of X below to nd your answer. pressure (atm) 24- 12 solid liquid gas 200 400 temperature (K) 600 ote: your answer must be within 0.15 atm of the exact answer to be graded correct. atm Thanation Check © 2025 McGraw Hill LLC. All Rights Reserved. Terms of Use | Privacy Center I Q Search L³ ملةarrow_forward301.7 348.9 193.7 308.6 339.5 160.6 337.7 464.7 223.5 370.5 326.6 327.5 336.1 317.9 203.8 329.8 221.9 331.7 211.7 309.6 223.4 353.7 334.6 305.6 340.0 304.3 244.7 QUESTION: Using this group of data on regular tomato sauce concentration readings answer the following questions: 1. 95% Cl Confidence Interval (mmol/L) 2. [Na+] (mg/100 mL) 3. 95% Na+ Confidence Interval (mg/100 mL)arrow_forwardSearch Results Search Results Best Free Coursehero Unlo x b Success Confirmation of Q aleks.com/alekscgi/x/sl.exe/10_u-lgNslkr7j8P3jH-IQs_pBan HhvlTCeeBZbufu BYTIOHz7m7D3ZcHYUt80XL-5alyVpwDXM TEZayFYCav States of Matter Using a phase diagram to find a phase transition temperature or pressure Use the phase diagram of Substance X below to find the temperature at which X turns to a gas, if the pressure above the solid is 3.7 atm. pressure (atm) 0. 32- 16 solid liquid gas 200 temperature (K) Note: your answer must be within 20 °C of the exact answer to be graded correct. Дос Xarrow_forward
- Consider the reaction below to answer the following questions: Acetoacetic ester can be prepared by the Claisen self-condensation reaction of ethyl acetate. 1. NaOEt, EtOH H&C OCH CH3 2 H30 H3C CH2 OCH2CH3 A. Write the complete stepwise mechanism for this reaction. Show all electron flow with arrows and draw all intermediate structures. B. Ethyl acetate can be prepared from ethanol as the only organic starting material. Show all reagents and structures for all intermediates in this preparation. C. Give the structures of the ester precursors for the following Claisen condensation product and formulate the reaction. OEtarrow_forwardUse the phase diagram of Substance X below to find the temperature at which X turns to a gas, if the pressure above the solid is 3.7 atm. pressure (atm) 32 16 solid liquid gas 0 0 200 temperature (K) Note: your answer must be within 20 °C of the exact answer to be graded correct. Шос ☑ كarrow_forwardStarting from bromoethane, how could you prepare the following compounds: a. Ethanol. b. Acetaldehyde f. Acetone. e. 2-Propanol i. Acetoacetic ester. d. 2-Bromoacetic acid. c. Acetic acid g. Acetamide. j. Ethylmalonate k. Gama ketoacid. h. Ethyl magnesium bromide.arrow_forward
- - The pressure above a pure sample of solid Substance X at 60. °C is raised. At what pressure will the sample melt? Use the phase diagram of X below to find your answer. pressure (atm) 02 0.4 solid Hliquid gas 0 0 200 400 600 temperature (K) Note: your answer must be within 0.025 atm of the exact answer to be graded correct. ☐ atmarrow_forward15. What is the order of decreasing reactivity towards nucleophilic acyl substitution for the carboxylic acid derivatives? (most reactive first) 0 O H3C COC CH3 H₂C C N(CH3)2 H3C C OCH3 A. a. I, 11, 111, b. I, III, IV, II C. II, IV, III, I ° (CH3)2CH C OCH3 IV d. II, I, III, IV B. R COCR 0 0 0 13= RC NH2 RC OR RC CI === IV a. I, III, II, IV b. II, III, I, IV C. III, II, I, IV d. IV, I, III, IIarrow_forwardDraw the formula of the product obtained by reacting D-Tallose with bromine water.arrow_forward
 ChemistryChemistryISBN:9781305957404Author:Steven S. Zumdahl, Susan A. Zumdahl, Donald J. DeCostePublisher:Cengage Learning
 ChemistryChemistryISBN:9781259911156Author:Raymond Chang Dr., Jason Overby ProfessorPublisher:McGraw-Hill Education
 Principles of Instrumental AnalysisChemistryISBN:9781305577213Author:Douglas A. Skoog, F. James Holler, Stanley R. CrouchPublisher:Cengage Learning
 Organic ChemistryChemistryISBN:9780078021558Author:Janice Gorzynski Smith Dr.Publisher:McGraw-Hill Education
 Chemistry: Principles and ReactionsChemistryISBN:9781305079373Author:William L. Masterton, Cecile N. HurleyPublisher:Cengage Learning
 Elementary Principles of Chemical Processes, Bind...ChemistryISBN:9781118431221Author:Richard M. Felder, Ronald W. Rousseau, Lisa G. BullardPublisher:WILEY