
Concept explainers
Videos
(a)
To find: the individuals in this data set.
(a)
Answer to Problem 2E
6 roller coasters
Explanation of Solution
Given:
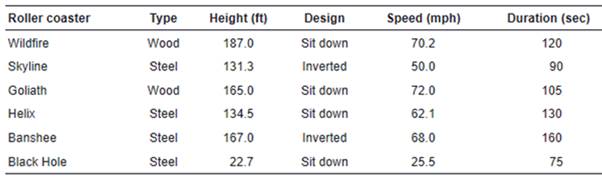
Individuals:
6 roller coasters in Amusement parks
(b)
To find: the variables and classify each as categorical or quantitative.
(b)
Answer to Problem 2E
Variables are Type, Height (ft), Design, Speed (mph), Duration (sec)
Type: Categorical
Height (ft): Quantitative
Design: Categorical
Duration: Quantitative
Explanation of Solution
Given:
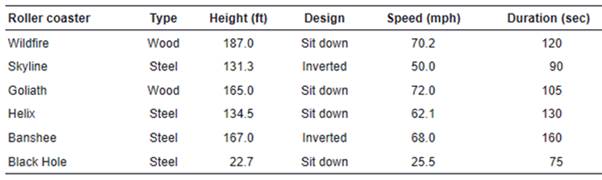
Variables are Type, Height (ft), Design, Speed (mph), Duration (sec)
Type: Categorical, there are two type of category
Height (ft): Quantitative, because the heights have numerical values.
Design: Categorical, because there are two type of category sit down and inverted.
Duration: Quantitative, because time is numerical quantity and not possible to list out.
Chapter 1 Solutions
PRACTICE OF STATISTICS F/AP EXAM
Additional Math Textbook Solutions
Algebra and Trigonometry (6th Edition)
College Algebra (7th Edition)
A First Course in Probability (10th Edition)
University Calculus: Early Transcendentals (4th Edition)
Introductory Statistics
Pre-Algebra Student Edition


- these are the questions and solutions. Please explain and show the method of the solutionsarrow_forwardPlease help me on this following statistics question.CSV DATA:"","CafData","DecafData""1","6",7"2","11",3"3","9",16"4","9",1"5","10",7"6","11",8"7","9",12"8","6",4"9","4",5"10","7",4"11","4",11"12","8",8"13","9",7"14","12",11"15","8",-4"16","10",1"17","",1"18","",1"19","",14arrow_forwardPlease help me on this following statistics questionDrop down options for (g) are: (be rejected/not be rejected) & (on average, significantly better/on average, not significantly better)CSV DATA:"","New_Therapy","Standard_Therapy""1","38.6",47.7"2","50.4",49.3"3","49.8",65"4","46.4",42.9"5","45.9",63.2"6","53.5",47.1"7","56.5",66.5"8","46",47.6"9","48.6",66.9"10","44.8",48"11","51",46.1"12","42.8",54.5"13","45.8",50.7"14","41",48.8"15","50.6",62.2"16","39.6",53.9"17","50.1",54.1"18","49",70.1"19","50.2",45.5"20","48.6",48.6"21","45",61.1"22","49.6",53.6"23","38.5",49"24","43.3",53.1"25","43.5",43.6"26","49",59.3"27","48.2",53.5"28","",53"29","",49.4"30","",60.7arrow_forward
- Please help me answer this following question on statistics The CSV data is below: "","cafe","library" "A",85,85 "B",64,61 "C",180,179 "D",136,135 "E",152,152 "F",174,169 "G",145,145 "H",87,86 "I",121,121 "J",149,146 "K",140,136 "L",159,159 "M",98,96 "N",130,130 "O",56,52 "P",140,141 "Q",76,78 "R",150,148 "S",133,132 "T",125,122 "U",123,122 "V",85,84 "W",84,85 "X",94,96 "Y",156,154 (a) Based on the above data structure, we should use a (2-sample T test (pooled variance)/Paired T (Matched Pairs) Test/2-sample T test (unequal variance)/Leven's Test.) (c) Carry out the appropriate statistical test and find the Test Statistic and P-value. Test Statistic= (use three decimals) Complete the interpretation and compute the P−value. Assuming H0 is (false/uncertain/true), the probability of (observing stronger evidence to support the rejecting the/failing to reject the/observing stronger evidence against the) null hypothesis is ___ (use three decimals). (d) Based on these samples, at the 5% level…arrow_forwardI need help on filling out this following table for statistics. Please help me find the chi squared value as well It has been suggusted that the highest priority of retirees is travel. Thus, a study was conducted to investigate the differences in the length of stay of a trip for pre- and post-retirees. A sample of 714 travelers were asked how long they stayed on a typical trip. The observed results of the study are found below. You may round all answers for this problem to the nearest hundredth. To import data to R, copy and paste the R codes below number=c(rep("4-7",421),rep("8-13",154),rep("14-21",88),rep("22_or_more",51)) retirement=c(rep("pre-retirement",248),rep("post-retirement",173),rep("pre-retirement",79),rep("post-retirement",75),rep("pre-retirement",36),rep("post- retirement",52),rep("pre-retirement",11),rep("post-retirement",40)) data=data.frame(number,retirement) table(data) With this information, construct a table of estimated expected values. Use two digits after the…arrow_forwardThe purpose of this problem is to solve the Black-Scholes PDE with analytical techniques, which will lead us back to the Black-Scholes formula. The technique is very similar to the one used with the Feynman-Kac formula back in MATH 467. Let's consider the PDE given by with terminal condition f(T,x) af + Ət 1 02 ર .2მ2 f af მ2 +rx მე - rf = 0, = (x-K)+. The solution f(t, x) corresponds to the price of a call option (given the initial condition) at time t if the stock price is x. (a) The first two things that prevent us from solving this PDE directly are (i) the fact that we have a terminal condition, instead of an initial condition; (ii) the terms in front of the derivatives are not constant. To address these, we use the transformation g(t, x) = ƒ(T − t,e³), equivalent to f(t, x) = g(T-t, log(x)). Under this condition, determine the PDE and the initial condition satisfied by g. (b) Now, the PDE obtained in (a) should have an initial condition and constant coeffi- cients, but it still…arrow_forward
- Please help me answer question b and c for this problem.A student project involved collecting data to see if there was a difference in the amount of time one had to wait at the drive-thru between two fast food restaurants, A and B. She randomly selected 30 cars at fast food restaurant A and 30 cars at fast food restaurant B. For each car chosen, she recorded how much time passed from the placement of the order to receiving their food at the pick-up window. The data is given in the table below measured in Seconds. Use α=0.05.CSV…arrow_forwardPlease help me with the following statistics problem A long-distance runner wants to compare the durability of two running shoe brands: Brand A and Brand B. Instead of testing them separately, 15 runners simultaneously wear Brand A on the left foot and Brand B on the right foot during training runs. The runner continues training as usual and tracks how many kilometers each shoe lasts before showing significant wear (e.g., loss of cushioning, outsole damage). Since both shoes experience the same runner, terrain, and conditions, any lifespan difference can be attributed to the shoe brand rather than external factors. Test whether Brand A running shoes have a significantly shorter lifespan than Brand B when worn under the same conditions by the same runner. CSV: "","A","B" "A",197,193 "B",230,229 "C",179,180 "D",206,205 "E",182,180 "F",141,142 "G",207,207 "H",116,112 "I",78,79 "J",0,0 "K",213,212 "L",86,83 "M",181,181 "N",85,79 "O",73,71 The…arrow_forwardAn article appeared in the Journal of Gambling Issues, in which the authors looked at random samples of Ontario residents who (i) have not completed some form of post-secondary education and (ii) have completed some form of post-secondary education. A code of 0 indicates the person does not have a gambling problem, a code of 1 indicates the person does have a gambling problem. The data is found in the accompanying data file. Download.csv file To count the frequencies of 0 and 1 in each sample, use the table(your_dataset_name$ column's name) function. Make sure to replace "your_dataset_name" with the actual name of your data file and specify the correct column name. For example: table(file60c5d1286c735$ CompletedPSEducation) Let PNOPS represent the proportion of persons not completing some form of post-secondary education who have a gambling problem, and PPs be the proportion of persons having completed post-secondary education who have a gambling problem. (a) Find a 92% confidence…arrow_forward
- We consider a (European) call option on a stock with expiration in 3 months and strike price $10. The annual interest rate on the market is r = 4%. The current price of the stock is $10 and we assume that the stock follows a geometric Brownian motion (Black-Scholes) model with parameters = 6% and σ = 0.2. (a) Determine the price Fo of this option at time t = : 0 (today). (b) Using the formulas provided in the lecture videos, calculate the value of each of the Greeks for this option. Namely, calculate A, T, v, О, p. (c) Find a formula for the change of the option price with respect to a change in the af (St, t) Әк strike price. In other words, determine (d) For each of the suggested modifications below, use an approximation to determine the change in the price of the option above without actually recalculating the price. For each one, provide an intuitive argument to explain why the price increases or decreases. (i) The rate of return μ decreases to 5%. (ii) The interest rate r…arrow_forwardA box containing 24 seemly identical resistors has just been received. However,unbeknownst, 4 of these resistors are defective. a. Five resistors are randomly selected from this box without replacement (oncemoved from the box it is not returned to the box), what is the probability that oneor more of the defective resistors is among those selected? b. Five resistors are randomly selected from this box with replacement (after theresistor is removed and checked, it is returned to the box prior to the nextselection (hence the same resistor can be selected more than once)), what is theprobability that one or more of the defective resistors is among those selected?arrow_forwardBusiness Discussarrow_forward
 MATLAB: An Introduction with ApplicationsStatisticsISBN:9781119256830Author:Amos GilatPublisher:John Wiley & Sons Inc
 Probability and Statistics for Engineering and th...StatisticsISBN:9781305251809Author:Jay L. DevorePublisher:Cengage Learning
 Statistics for The Behavioral Sciences (MindTap C...StatisticsISBN:9781305504912Author:Frederick J Gravetter, Larry B. WallnauPublisher:Cengage Learning
 Elementary Statistics: Picturing the World (7th E...StatisticsISBN:9780134683416Author:Ron Larson, Betsy FarberPublisher:PEARSON
 The Basic Practice of StatisticsStatisticsISBN:9781319042578Author:David S. Moore, William I. Notz, Michael A. FlignerPublisher:W. H. Freeman
 Introduction to the Practice of StatisticsStatisticsISBN:9781319013387Author:David S. Moore, George P. McCabe, Bruce A. CraigPublisher:W. H. Freeman