
Concept explainers
Videos
(a)
To find: the distribution has a clear left-skewed shape.
(a)
Answer to Problem 120E
Monday, Wednesday and Sunday
Explanation of Solution
Given:

The distribution has a skewed to the left shape, if the box of the box plot lies closest to the top between the whiskers of the box plot and if the horizontal line (
It is observed that the distribution of Monday, Wednesday and Saturday have the left- skewed shape, because the box of the box plot is lying near the top between the whiskers of the box plot.
(b)
To find: the outlier stands out the most.
(b)
Answer to Problem 120E
Outlier of the Friday distribution, the reason is that the outlier lies furthest from the box plot of the distribution
Explanation of Solution
Given:

The outliers are showed by little circles in the box plots.
It is observed that there are four distributions with outliers: Tuesday, Thursday, Friday and Sunday.
The outlier that stands out the most is the outlier that lies furthest from the box plot and therefore the outlier of Friday stands out the most, as it is furthest from the box plot.
(c)
To find: the typical amount of sleep that the students got compare on these 7 nights.
(c)
Answer to Problem 120E
The highest typical amount of sleep occurs on Friday, while the lowest typical amount of sleep occurs on Thursday and the typical amount of sleep tends to decrease day by day from Friday to Thursday.
Explanation of Solution
Given:
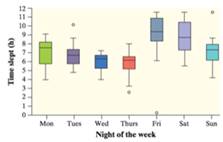
The typical amount of sleep that the students get are showed by the horizontal lines in the box of the box plot and it is observed that the highest typical amount of sleep occurs on where the lowest typical amount of sleep occurs on Thursday and the typical amount of sleep tends to decrease day by day from Friday to Thursday
(d)
To find: the night was the most variation in the students slept.
(d)
Answer to Problem 120E
Saturday night.
Explanation of Solution
Given:

The variation in the distribution is showed by the width between the whiskers of the box plot.
It is observe that the width between the whiskers of the whiskers of the box plot is higher for Saturday, which means that the most variation in the amount of sleep occurs on Saturday night.
Chapter 1 Solutions
PRACTICE OF STATISTICS F/AP EXAM
Additional Math Textbook Solutions
A First Course in Probability (10th Edition)
Pre-Algebra Student Edition
Elementary Statistics: Picturing the World (7th Edition)
Basic Business Statistics, Student Value Edition
Algebra and Trigonometry (6th Edition)


- NC Current Students - North Ce X | NC Canvas Login Links - North ( X Final Exam Comprehensive x Cengage Learning x WASTAT - Final Exam - STAT → C webassign.net/web/Student/Assignment-Responses/submit?dep=36055360&tags=autosave#question3659890_9 Part (b) Draw a scatter plot of the ordered pairs. N Life Expectancy Life Expectancy 80 70 600 50 40 30 20 10 Year of 1950 1970 1990 2010 Birth O Life Expectancy Part (c) 800 70 60 50 40 30 20 10 1950 1970 1990 W ALT 林 $ # 4 R J7 Year of 2010 Birth F6 4+ 80 70 60 50 40 30 20 10 Year of 1950 1970 1990 2010 Birth Life Expectancy Ox 800 70 60 50 40 30 20 10 Year of 1950 1970 1990 2010 Birth hp P.B. KA & 7 80 % 5 H A B F10 711 N M K 744 PRT SC ALT CTRLarrow_forwardHarvard University California Institute of Technology Massachusetts Institute of Technology Stanford University Princeton University University of Cambridge University of Oxford University of California, Berkeley Imperial College London Yale University University of California, Los Angeles University of Chicago Johns Hopkins University Cornell University ETH Zurich University of Michigan University of Toronto Columbia University University of Pennsylvania Carnegie Mellon University University of Hong Kong University College London University of Washington Duke University Northwestern University University of Tokyo Georgia Institute of Technology Pohang University of Science and Technology University of California, Santa Barbara University of British Columbia University of North Carolina at Chapel Hill University of California, San Diego University of Illinois at Urbana-Champaign National University of Singapore McGill…arrow_forwardName Harvard University California Institute of Technology Massachusetts Institute of Technology Stanford University Princeton University University of Cambridge University of Oxford University of California, Berkeley Imperial College London Yale University University of California, Los Angeles University of Chicago Johns Hopkins University Cornell University ETH Zurich University of Michigan University of Toronto Columbia University University of Pennsylvania Carnegie Mellon University University of Hong Kong University College London University of Washington Duke University Northwestern University University of Tokyo Georgia Institute of Technology Pohang University of Science and Technology University of California, Santa Barbara University of British Columbia University of North Carolina at Chapel Hill University of California, San Diego University of Illinois at Urbana-Champaign National University of Singapore…arrow_forward
- A company found that the daily sales revenue of its flagship product follows a normal distribution with a mean of $4500 and a standard deviation of $450. The company defines a "high-sales day" that is, any day with sales exceeding $4800. please provide a step by step on how to get the answers in excel Q: What percentage of days can the company expect to have "high-sales days" or sales greater than $4800? Q: What is the sales revenue threshold for the bottom 10% of days? (please note that 10% refers to the probability/area under bell curve towards the lower tail of bell curve) Provide answers in the yellow cellsarrow_forwardFind the critical value for a left-tailed test using the F distribution with a 0.025, degrees of freedom in the numerator=12, and degrees of freedom in the denominator = 50. A portion of the table of critical values of the F-distribution is provided. Click the icon to view the partial table of critical values of the F-distribution. What is the critical value? (Round to two decimal places as needed.)arrow_forwardA retail store manager claims that the average daily sales of the store are $1,500. You aim to test whether the actual average daily sales differ significantly from this claimed value. You can provide your answer by inserting a text box and the answer must include: Null hypothesis, Alternative hypothesis, Show answer (output table/summary table), and Conclusion based on the P value. Showing the calculation is a must. If calculation is missing,so please provide a step by step on the answers Numerical answers in the yellow cellsarrow_forward
 MATLAB: An Introduction with ApplicationsStatisticsISBN:9781119256830Author:Amos GilatPublisher:John Wiley & Sons Inc
 Probability and Statistics for Engineering and th...StatisticsISBN:9781305251809Author:Jay L. DevorePublisher:Cengage Learning
 Statistics for The Behavioral Sciences (MindTap C...StatisticsISBN:9781305504912Author:Frederick J Gravetter, Larry B. WallnauPublisher:Cengage Learning
 Elementary Statistics: Picturing the World (7th E...StatisticsISBN:9780134683416Author:Ron Larson, Betsy FarberPublisher:PEARSON
 The Basic Practice of StatisticsStatisticsISBN:9781319042578Author:David S. Moore, William I. Notz, Michael A. FlignerPublisher:W. H. Freeman
 Introduction to the Practice of StatisticsStatisticsISBN:9781319013387Author:David S. Moore, George P. McCabe, Bruce A. CraigPublisher:W. H. Freeman