
Concept explainers
Videos
(a)
To find: the proportion of the women in this study had a child with one or more birth defect.
(a)
Answer to Problem T1.12SPT
0.0439
Explanation of Solution
Given:
| Non diabetic | Pre diabetic | Diabetic | |
| Non | 754 | 362 | 38 |
| one or more | 31 | 13 | 9 |
Calculation:
Suppose first find the row/ column totals, which is the sum of all counts in the associating row/ column.
| Non diabetic | Pre diabetic | Diabetic | total | |
| Non | 754 | 362 | 38 | 1154 |
| one or more | 31 | 13 | 9 | 53 |
| total | 785 | 375 | 47 | 1207 |
It is observed the table is having the data about 1207 women and that 53 of the 1207 women had a child with one or more birth defects (as 53 is mentioned in the row “One or more” and in the column “Row Total” of the above table).
Therefore is a proportion of 0.0439 women had a child with one or more birth defects.
(b)
To find: the percent of the women in this study were diabetic or pre diabetic.
(b)
Answer to Problem T1.12SPT
1.823%
Explanation of Solution
Given:
| Non diabetic | Pre diabetic | Diabetic | |
| Non | 754 | 362 | 38 |
| one or more | 31 | 13 | 9 |
Calculation:
Let us first determine the row/column totals of the given table, which is the sum of all counts in the associating row/ column.
| Non diabetic | Pre diabetic | Diabetic | total | |
| Non | 754 | 362 | 38 | 1154 |
| one or more | 31 | 13 | 9 | 53 |
| total | 785 | 375 | 47 | 1207 |
It is observed that the table is having the data about 1207 women and that 13 of the 1207 women were pre diabetic and had a child with one or more birth defects where 9 of the 1207 women were diabetic and had a child with one or more birth defects
Therefore 1.823% of the women in the study was pre diabetic, and has a child with one or more birth defects.
(c)
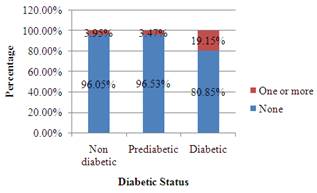
To construct: a segmented bar graph to show the distribution of number of birth defects for the women with every three diabetic statues.
(c)
Explanation of Solution
Calculation:
Let us first find the row/column totals of the given table, which is the sum of all counts in the associating row/ column.
| Non diabetic | Pre diabetic | Diabetic | total | |
| Non | 754 | 362 | 38 | 1154 |
| one or more | 31 | 13 | 9 | 53 |
| total | 785 | 375 | 47 | 1207 |
To find the distribution of superpower preference from every country, and divide the counts by the column total.
| Non diabetic | Pre diabetic | Diabetic | |
| None | 96.05% | 96.53% | 80.85% |
| One or more | 3.95% | 3.47% | 19.15% |
Graph:
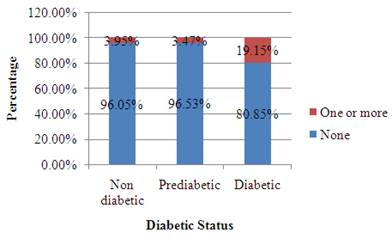
The width of the every bar has to be the same and the height has to be equal to the percent.
(d)
To Explain: the nature of the association between mother’s diabetic status and number of birth defects for the women in this study.
(d)
Answer to Problem T1.12SPT
The number of birth defects gets to be highest for the Diabetics and lowest for the Non diabetics.
Explanation of Solution
Given:
From the part (c)
It is observed that the number of birth defects gets to be highest for the Diabetics and lowest for the Non diabetics, the reason is that the green area of the bars is greatest for Diabetic and least for non diabetic.
Chapter 1 Solutions
PRACTICE OF STATISTICS F/AP EXAM
Additional Math Textbook Solutions
Algebra and Trigonometry (6th Edition)
Elementary Statistics
University Calculus: Early Transcendentals (4th Edition)
Intro Stats, Books a la Carte Edition (5th Edition)
Pre-Algebra Student Edition


- A company found that the daily sales revenue of its flagship product follows a normal distribution with a mean of $4500 and a standard deviation of $450. The company defines a "high-sales day" that is, any day with sales exceeding $4800. please provide a step by step on how to get the answers in excel Q: What percentage of days can the company expect to have "high-sales days" or sales greater than $4800? Q: What is the sales revenue threshold for the bottom 10% of days? (please note that 10% refers to the probability/area under bell curve towards the lower tail of bell curve) Provide answers in the yellow cellsarrow_forwardFind the critical value for a left-tailed test using the F distribution with a 0.025, degrees of freedom in the numerator=12, and degrees of freedom in the denominator = 50. A portion of the table of critical values of the F-distribution is provided. Click the icon to view the partial table of critical values of the F-distribution. What is the critical value? (Round to two decimal places as needed.)arrow_forwardA retail store manager claims that the average daily sales of the store are $1,500. You aim to test whether the actual average daily sales differ significantly from this claimed value. You can provide your answer by inserting a text box and the answer must include: Null hypothesis, Alternative hypothesis, Show answer (output table/summary table), and Conclusion based on the P value. Showing the calculation is a must. If calculation is missing,so please provide a step by step on the answers Numerical answers in the yellow cellsarrow_forward
 MATLAB: An Introduction with ApplicationsStatisticsISBN:9781119256830Author:Amos GilatPublisher:John Wiley & Sons Inc
 Probability and Statistics for Engineering and th...StatisticsISBN:9781305251809Author:Jay L. DevorePublisher:Cengage Learning
 Statistics for The Behavioral Sciences (MindTap C...StatisticsISBN:9781305504912Author:Frederick J Gravetter, Larry B. WallnauPublisher:Cengage Learning
 Elementary Statistics: Picturing the World (7th E...StatisticsISBN:9780134683416Author:Ron Larson, Betsy FarberPublisher:PEARSON
 The Basic Practice of StatisticsStatisticsISBN:9781319042578Author:David S. Moore, William I. Notz, Michael A. FlignerPublisher:W. H. Freeman
 Introduction to the Practice of StatisticsStatisticsISBN:9781319013387Author:David S. Moore, George P. McCabe, Bruce A. CraigPublisher:W. H. Freeman