
Concept explainers
Videos
a.
To describe the overall shape of the distribution of monthly returns for the U.S. stock market over a 273-month period.
a.
Answer to Problem 71E
The distribution is skewed to the left and the distribution appears to contain 3 outliers with 2 gaps.
Explanation of Solution
The figure below shows a histogram of the distribution of monthly returns for the U.S. stock market over a 273-month period:

The distribution is skewed to the left, because the highest bars are to the right in the histogram with a tail of smaller bars to the left.
The distribution appears to contain 3 outliers, because there are two bars (one with frequency 2 and the other with frequency 1) which are separated by a gap from the other bars of the histogram.
The gaps are roughly at -20 and -13, while there are two potential outliers between -25 and -22.5, with one other potential outlier between -17.5 and -15.
b.
To determine the approximate center of this distribution of monthly returns for the U.S. stock market over a 273-month period.
b.
Answer to Problem 71E
The center of this distribution to be between 0% and 2.5%.
Explanation of Solution
The figure below shows a histogram of the distribution of monthly returns for the U.S. stock market over a 273-month period:
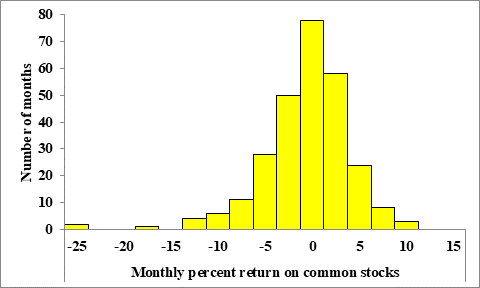
We expect the center of the distribution to be roughly at the highest bar in the histogram.
The highest bar has monthly percent returns between 0% and 2.5%, thus we then estimate the center of this distribution to be between 0% and 2.5%.
c.
To determine why we cannot find the exact value for the minimum return and between what two values does it lie.
c.
Answer to Problem 71E
We cannot determine the exact value of the minimum return, because we have not been given its exact value and we only know a
The minimum return is between -25% and -22.5%.
Explanation of Solution
The figure below shows a histogram of the distribution of monthly returns for the U.S. stock market over a 273-month period:

The minimum return is represented by the left most bar in the histogram.
However, we cannot determine the exact value of the minimum return, because we have not been given its exact value and we only know a range of possible values for the minimum return by the corresponding bar in the histogram.
We note that the leftmost bar in the histogram takes on monthly percent returns on common stocks between -25% and -22.5%, which then implies that the minimum return is between -25% and -22.5%.
d.
To determine about what percent of all months had returns less than 0 for the U.S. stock market over a 273-month period.
d.
Answer to Problem 71E
Approximately, 37.36% of the months has returns less than 0.
Explanation of Solution
The figure below shows a histogram of the distribution of monthly returns for the U.S. stock market over a 273-month period:

Let us first estimate the frequency of corresponding to the interval of each bar, which is given by the height of the bars.
| Interval | Frequency |
| -25 < -22.5 | 2 |
| -22.5 < -20 | 0 |
| -20 < -17.5 | 0 |
| -17.5 < -15 | 1 |
| -15 < -12.5 | 0 |
| -12.5 < -10 | 4 |
| -10 < -7.5 | 6 |
| -7.5 < -5 | 11 |
| -5 < -2.5 | 28 |
| -2.5 < 0 | 50 |
| 0 < 2.5 | 78 |
| 2.5 < 5 | 58 |
| 5 < 7.5 | 24 |
| 7.5 < 10 | 8 |
| 10 < 12.5 | 3 |
Let us next add the frequencies of all intervals with negative returns.

Thus we then note that 102 of the 273 months in the sample have a return less than 0.
This then implies that approximately 37.36% of the months has returns less than 0.
Chapter 1 Solutions
PRACTICE OF STATISTICS F/AP EXAM
Additional Math Textbook Solutions
Calculus: Early Transcendentals (2nd Edition)
Calculus for Business, Economics, Life Sciences, and Social Sciences (14th Edition)
Calculus: Early Transcendentals (2nd Edition)
A Problem Solving Approach To Mathematics For Elementary School Teachers (13th Edition)


- please find the answers for the yellows boxes using the information and the picture belowarrow_forwardA marketing agency wants to determine whether different advertising platforms generate significantly different levels of customer engagement. The agency measures the average number of daily clicks on ads for three platforms: Social Media, Search Engines, and Email Campaigns. The agency collects data on daily clicks for each platform over a 10-day period and wants to test whether there is a statistically significant difference in the mean number of daily clicks among these platforms. Conduct ANOVA test. You can provide your answer by inserting a text box and the answer must include: also please provide a step by on getting the answers in excel Null hypothesis, Alternative hypothesis, Show answer (output table/summary table), and Conclusion based on the P value.arrow_forwardA company found that the daily sales revenue of its flagship product follows a normal distribution with a mean of $4500 and a standard deviation of $450. The company defines a "high-sales day" that is, any day with sales exceeding $4800. please provide a step by step on how to get the answers Q: What percentage of days can the company expect to have "high-sales days" or sales greater than $4800? Q: What is the sales revenue threshold for the bottom 10% of days? (please note that 10% refers to the probability/area under bell curve towards the lower tail of bell curve) Provide answers in the yellow cellsarrow_forward
- Business Discussarrow_forwardThe following data represent total ventilation measured in liters of air per minute per square meter of body area for two independent (and randomly chosen) samples. Analyze these data using the appropriate non-parametric hypothesis testarrow_forwardeach column represents before & after measurements on the same individual. Analyze with the appropriate non-parametric hypothesis test for a paired design.arrow_forward
- Should you be confident in applying your regression equation to estimate the heart rate of a python at 35°C? Why or why not?arrow_forwardGiven your fitted regression line, what would be the residual for snake #5 (10 C)?arrow_forwardCalculate the 95% confidence interval around your estimate of r using Fisher’s z-transformation. In your final answer, make sure to back-transform to the original units.arrow_forward
 MATLAB: An Introduction with ApplicationsStatisticsISBN:9781119256830Author:Amos GilatPublisher:John Wiley & Sons Inc
 Probability and Statistics for Engineering and th...StatisticsISBN:9781305251809Author:Jay L. DevorePublisher:Cengage Learning
 Statistics for The Behavioral Sciences (MindTap C...StatisticsISBN:9781305504912Author:Frederick J Gravetter, Larry B. WallnauPublisher:Cengage Learning
 Elementary Statistics: Picturing the World (7th E...StatisticsISBN:9780134683416Author:Ron Larson, Betsy FarberPublisher:PEARSON
 The Basic Practice of StatisticsStatisticsISBN:9781319042578Author:David S. Moore, William I. Notz, Michael A. FlignerPublisher:W. H. Freeman
 Introduction to the Practice of StatisticsStatisticsISBN:9781319013387Author:David S. Moore, George P. McCabe, Bruce A. CraigPublisher:W. H. Freeman