
a)
The variability in sugar content of cereals in the three shelves.
The variability in sugar content of cereals on bottom shelf and middle shelf are same and are different from top shelf.
Given:Data of 76 brands of cereal at a local super market showing the sugar content and the shelf in super market the cereal brand is located in the form of below shown dot plot.
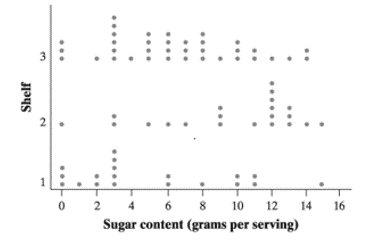
Explanation:The sugar content in bottom shelf -1 vary from 0 grams per serving to 15 grams per serving.
The sugar content in middle shelf -2 vary from 0 grams per serving to 15 grams per serving.
The sugar content in top shelf -3 vary from 0 grams per serving to 14 grams per serving.
So the variability in sugar content in bottom and middle shelves are same and are different from top shelf.
b)
To determine: Whether the critics claim that super markets tend to put sugary cereals where kids can see them is correct or not.
The data from the study support the critics claim that super markets tend to put sugary cereals where kids can see them.
Explanation:From the given dot plot, the data distribution of sugar content in bottom shelf and top shelf are skewed to the right and there are less number of sugary cereals with high sugar content. The data distribution of sugar content in middle shelf is skewed to left, so there are more number of cereals with high sugar content in middle shelf. From the given information the shelf − 2 middle shelf is at about eye level for kids in most super markets.
Hence the data supports the critics claim that super markets tend to put sugary cereals where kids can see them.
Chapter 1 Solutions
PRACTICE OF STATISTICS F/AP EXAM
Additional Math Textbook Solutions
College Algebra (7th Edition)
Intro Stats, Books a la Carte Edition (5th Edition)
Calculus: Early Transcendentals (2nd Edition)
A First Course in Probability (10th Edition)
Thinking Mathematically (6th Edition)

- Find the critical value for a left-tailed test using the F distribution with a 0.025, degrees of freedom in the numerator=12, and degrees of freedom in the denominator = 50. A portion of the table of critical values of the F-distribution is provided. Click the icon to view the partial table of critical values of the F-distribution. What is the critical value? (Round to two decimal places as needed.)arrow_forwardA retail store manager claims that the average daily sales of the store are $1,500. You aim to test whether the actual average daily sales differ significantly from this claimed value. You can provide your answer by inserting a text box and the answer must include: Null hypothesis, Alternative hypothesis, Show answer (output table/summary table), and Conclusion based on the P value. Showing the calculation is a must. If calculation is missing,so please provide a step by step on the answers Numerical answers in the yellow cellsarrow_forwardShow all workarrow_forward
- Show all workarrow_forwardplease find the answers for the yellows boxes using the information and the picture belowarrow_forwardA marketing agency wants to determine whether different advertising platforms generate significantly different levels of customer engagement. The agency measures the average number of daily clicks on ads for three platforms: Social Media, Search Engines, and Email Campaigns. The agency collects data on daily clicks for each platform over a 10-day period and wants to test whether there is a statistically significant difference in the mean number of daily clicks among these platforms. Conduct ANOVA test. You can provide your answer by inserting a text box and the answer must include: also please provide a step by on getting the answers in excel Null hypothesis, Alternative hypothesis, Show answer (output table/summary table), and Conclusion based on the P value.arrow_forward
 MATLAB: An Introduction with ApplicationsStatisticsISBN:9781119256830Author:Amos GilatPublisher:John Wiley & Sons Inc
 Probability and Statistics for Engineering and th...StatisticsISBN:9781305251809Author:Jay L. DevorePublisher:Cengage Learning
 Statistics for The Behavioral Sciences (MindTap C...StatisticsISBN:9781305504912Author:Frederick J Gravetter, Larry B. WallnauPublisher:Cengage Learning
 Elementary Statistics: Picturing the World (7th E...StatisticsISBN:9780134683416Author:Ron Larson, Betsy FarberPublisher:PEARSON
 The Basic Practice of StatisticsStatisticsISBN:9781319042578Author:David S. Moore, William I. Notz, Michael A. FlignerPublisher:W. H. Freeman
 Introduction to the Practice of StatisticsStatisticsISBN:9781319013387Author:David S. Moore, George P. McCabe, Bruce A. CraigPublisher:W. H. Freeman