Concept explainers
Videos
To review:
The class of each of the given sugars.
Introduction:
Carbohydrates are the most abundant
Explanation of Solution
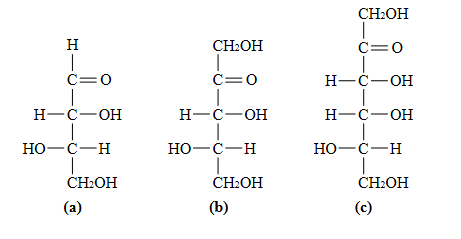
The simplest carbohydrate, monosaccharide can either be aldoses or ketoses based on its functional group. When the functional group is an aldehyde, it is called an aldose. It is a ketose when the functional group is a ketone. The class, to which the given molecules belong, is described below:
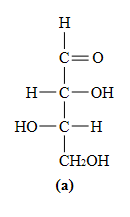
The above figure (a) is the structure of the monosaccharide
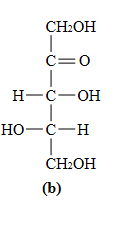
The figure number (b) shows the structure of
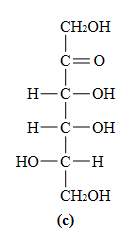
The above diagram (c) depicts the structure of
Thus, it can be concluded that the figure (a)depicts
Want to see more full solutions like this?
Chapter 7 Solutions
Biochemistry: The Molecular Basis of Life


- Please draw out the mechanism with curved arrows showing electron flow. Pyruvate is accepted into the TCA cycle by a “feeder” reaction using the pyruvate dehydrogenase complex, resulting in acetyl-CoA and CO2. Provide the mechanism for this reaction utilizing the TPP cofactor. Include the roles of all cofactors.arrow_forwardPyruvate is accepted into the TCA cycle by a “feeder” reaction using the pyruvate dehydrogenase complex, resulting in acetyl-CoA and CO2. Provide the mechanism for this reaction utilizing the TPP cofactor. Include the roles of all cofactors.arrow_forwardThe mitochondrial ATP synthase has 10 copies of the F0 subunit “c”, and the [H ] in the mitochondrial inner membrane space (IMS) is 6.31 x 10⁻⁸ M and the [H + ] in the matrix is 3.16 x 10⁻⁹ M. Calculate the minimum membrane potential (∆Ψ) necessary to make ATP synthesis thermodynamically favorable. [Assume ∆G' ofphosphate hydrolysis of ATP is - 45 kJ/mol.]arrow_forward
- B- Vitamins are converted readily into important metabolic cofactors. Deficiency in any one of them has serious side effects. a. The disease beriberi results from a vitamin B 1 (Thiamine) deficiency and is characterized by cardiac and neurological symptoms. One key diagnostic for this disease is an increased level of pyruvate and α-ketoglutarate in the bloodstream. How does this vitamin deficiency lead to increased serumlevels of these factors? b. What would you expect the effect on the TCA intermediates for a patient suffering from vitamin B 5 deficiency? c. What would you expect the effect on the TCA intermediates for a patientsuffering from vitamin B 2 /B 3 deficiency?arrow_forwardPyruvate is accepted into the TCA cycle by a “feeder” reaction using the pyruvate dehydrogenase complex, resulting in acetyl-CoA and CO2. Provide a full mechanism for this reaction utilizing the TPP cofactor. Include the roles of all cofactors.arrow_forwardMap out all of the metabolic pathways in the liver cell. Draw out the structures and names of all compounds neatly by hand and the pathways responsible for metabolizing them. Some examples are: Glycolysis/gluconeogenesis, PPP, Glycogenesis/glycogenolysis, Krebs, ETC, selectamino acid pathways (Ala, Glu, Asp) Lipogenesis/lipolysis. Citrate/MAS/glycerol phosphate shuttlesystems, and the Cori/Glc-Ala cycles. Rules:-Draw both a mitochondrial area of metabolism and a cytoplasmic area of metabolism.-Draw the liver and its roles in glucose recycling (Cori cycle/Glc-Alanine recycling)-Avoid drawing the same molecule twice (except for separate mitochondrial/cytoplasmic populations. i.e. Design the PPP/Glycolysis so that GAP is only drawn once)-Label Carbon 4 of glucose and highlight where you would expect to find it in EVERY compound in whichit is present.-Have one or two locations for NADH/NADPH/ATP/GTP/CoQH2 – many arrows will come to/from thesespots.arrow_forward
- a. Draw the Krebs Cycle and show the entry points for the amino acids Alanine,Glutamic Acid, Asparagine, and Valine into the Krebs Cycle. (Include name of Enzymes involved) b. How many rounds of Krebs will be required to waste all Carbons of Glutamic Acid as CO2? (Show by drawing out the mechanism that occurs)arrow_forwardThe malate-aspartate shuttle allows malate to be exchanged for aspartate acrossthe inner mitochondrial membrane. (a) Describe the role of the malate-aspartate shuttle in liver cells under HIGHblood glucose conditions. Be sure to explain your answer. (b) Describe the role of the malate-aspartate shuttle in liver cells under LOW blood + glucose conditions.arrow_forward(a) Write out the net reaction, calculate ∆E ̊' for the reaction, and calculate the standard free-energy change (∆G°') for the overall oxidation/reduction reaction. (h) How many moles of ATP could theoretically be generated per mole of FADH2 oxidized by this reaction, given a ∆G ̊' of ATP synthesis of + 31 kJ/mol? How many moles of ATP could be generated per mole of FADH2 oxidized by this reaction under more typical cellular conditions (where ∆G' of ATP hydrolysis is ~ -50 kJ/mol)? Be sure to show your work and explain your answer.arrow_forward
- Indicate for the reactions below which type of enzyme and cofactor(s) (if any) would be required to catalyze each reaction shown. 1) Fru-6-P + Ery-4-P <--> GAP + Sed-7-P2) Fru-6-P + Pi <--> Fru-1,6-BP + H2O3) GTP + ADP <--> GDP + ATP4) Sed-7-P + GAP <--> Rib-5-P + Xyl-5-P5) Oxaloacetate + GTP ---> PEP + GDP + CO26) DHAP + Ery-4-P <--> Sed-1,7-BP + H2O7) Pyruvate + ATP + HCO3- ---> Oxaloacetate + ADP + Piarrow_forwardThe phosphate translocase is an inner mitochondrial membrane symporter that transports H2PO4- and H+ into the mitochondrial matrix. Phosphate is a substrate for Complex V (the ATP Synthase), the enzyme that couples the synthesis of ATP to the H+ gradient formed by the electron transport chain. (a) Bongotoxin is a hypothetical compound that inhibits the phosphate translocase of the inner mitochondrial membrane. Explain why electron transport from NADH to O2 stops when bongotoxin is added to mitochondria (i.e., why do electrons stop flowing through the electron transport chain even with an abundance of NADH and O 2 present). What effect will the addition of the weak acid dinitrophenol (DNP) to the cytosol have on electron transport in bongotoxin-inhibited mitochondria? Be sure to explain your answers. (b) How much free energy is released (in kJ) when one mole of protons flows from the mitochondrial inner membrane space (IMS) to the mitochondrial matrix when the [H+ ] in the IMS is 7.9 x…arrow_forwardWhen TMPD/ascorbate is added to mitochondria as a source of electrons (TMPD/ascorbate reduce cytochrome c directly) oxygen is reduced to H2O by the electron transport chain (ETC).(a) Approximately how many ATPs would result per O2 consumed when electrons come from TMPD/ascorbate? (b) If dinitrophenol (DNP) is added to the mitochondria in (a) above, what effect would DNP have on the yield of ATPs per O2 reduced from TMPD/ascorbate electrons?arrow_forward
 Biology Today and Tomorrow without Physiology (Mi...BiologyISBN:9781305117396Author:Cecie Starr, Christine Evers, Lisa StarrPublisher:Cengage Learning

 Biology (MindTap Course List)BiologyISBN:9781337392938Author:Eldra Solomon, Charles Martin, Diana W. Martin, Linda R. BergPublisher:Cengage Learning
 Biology 2eBiologyISBN:9781947172517Author:Matthew Douglas, Jung Choi, Mary Ann ClarkPublisher:OpenStax